How to make radar chart have radial-gradient from the center
Open
- Dominant language
- TypeScript
- Stars
- 2.7k
- Forks
- 591
- PR merge metrics
- No merged PRs in 30d
Description
* **G2Plot Version**: v2
* **Platform**:Linux
How to make the radar chart look something like this
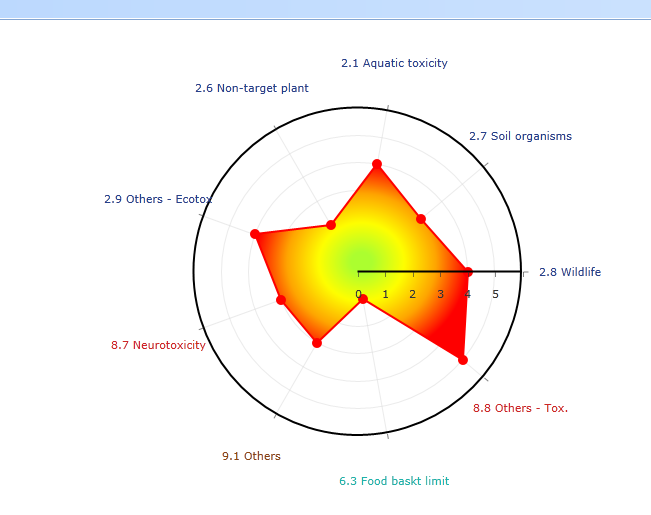
two colors from white to red will do for me.
I've been struggling with this for days
Contributor guide
Research direction
No file, test, or entry point is mentioned. Start by locating the radar chart configuration in G2Plot v2 and reviewing how chart fills are specified; done means documenting or enabling a radial white-to-red gradient matching the requested appearance.
Written by the indexing model from the issue text.
Assessment
- Tech stack
- typescript
- Domain
- data-visualization
- Issue type
- Feature
- Difficulty
- 4/5
- Estimated time
- 3-5 days
- Activity status
- Stale
- Clarity
- Needs clarification
- Newbie friendliness
- 30/100