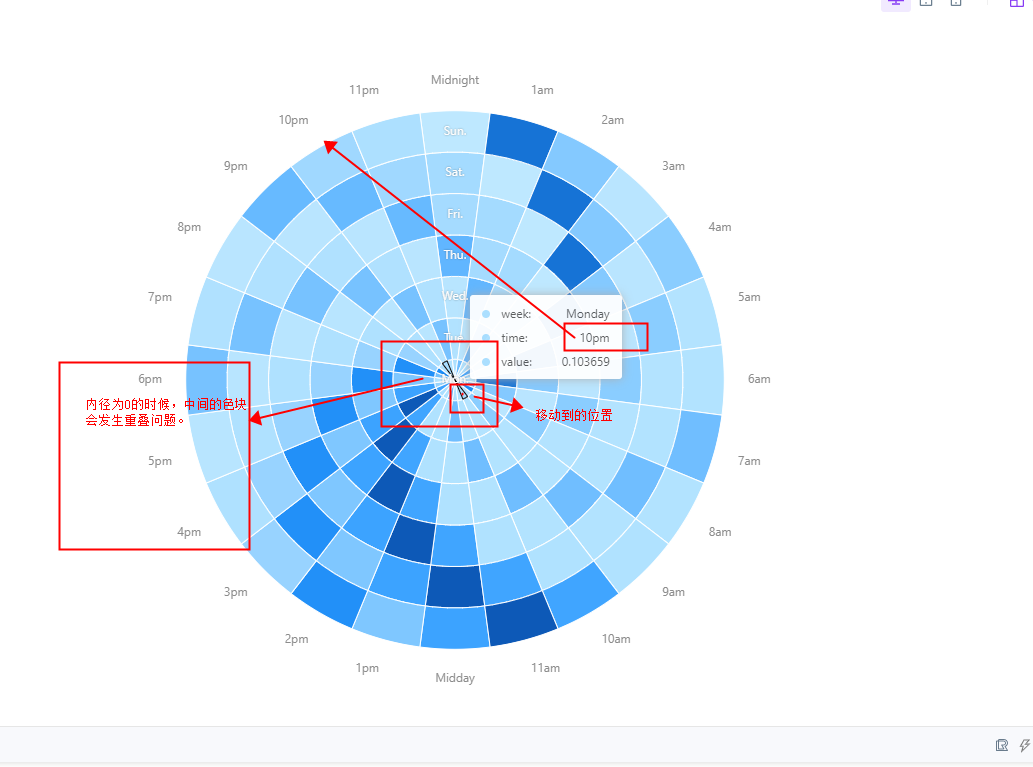
色块图/热力图 极坐标系下的内径为0时,中心的色块会发生重叠问题
Open
- Dominant language
- TypeScript
- Stars
- 2.7k
- Forks
- 591
- PR merge metrics
- No merged PRs in 30d
Description
* **G2Plot Version**: 2.3.17
色块图/热力图 HeatMap 极坐标下
问题:
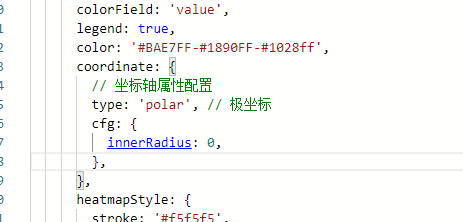
色块图/热力图 极坐标系下的内径为0时,中心的色块会发生重叠问题
特别时tooltip的显示,会发生错乱,已经 hover的交互上。
Contributor guide
Research direction
Start by reproducing the HeatMap in a polar coordinate system with the inner radius set to 0, using the screenshots and the reported G2Plot version as context. Inspect the chart's center rendering and hover/tooltip interaction; done means the central color blocks no longer overlap and tooltip behavior remains correct.
Written by the indexing model from the issue text.
Assessment
- Tech stack
- typescript
- Domain
- data-visualization
- Issue type
- Bug
- Difficulty
- 4/5
- Estimated time
- 3-5 days
- Activity status
- Stale
- Clarity
- Mostly clear
- Newbie friendliness
- 35/100