🌹玫瑰图🌹,当数据中存在负数时,会无视轴显示范围的设置。
- Dominant language
- TypeScript
- Stars
- 2.7k
- Forks
- 591
- PR merge metrics
- No merged PRs in 30d
Description
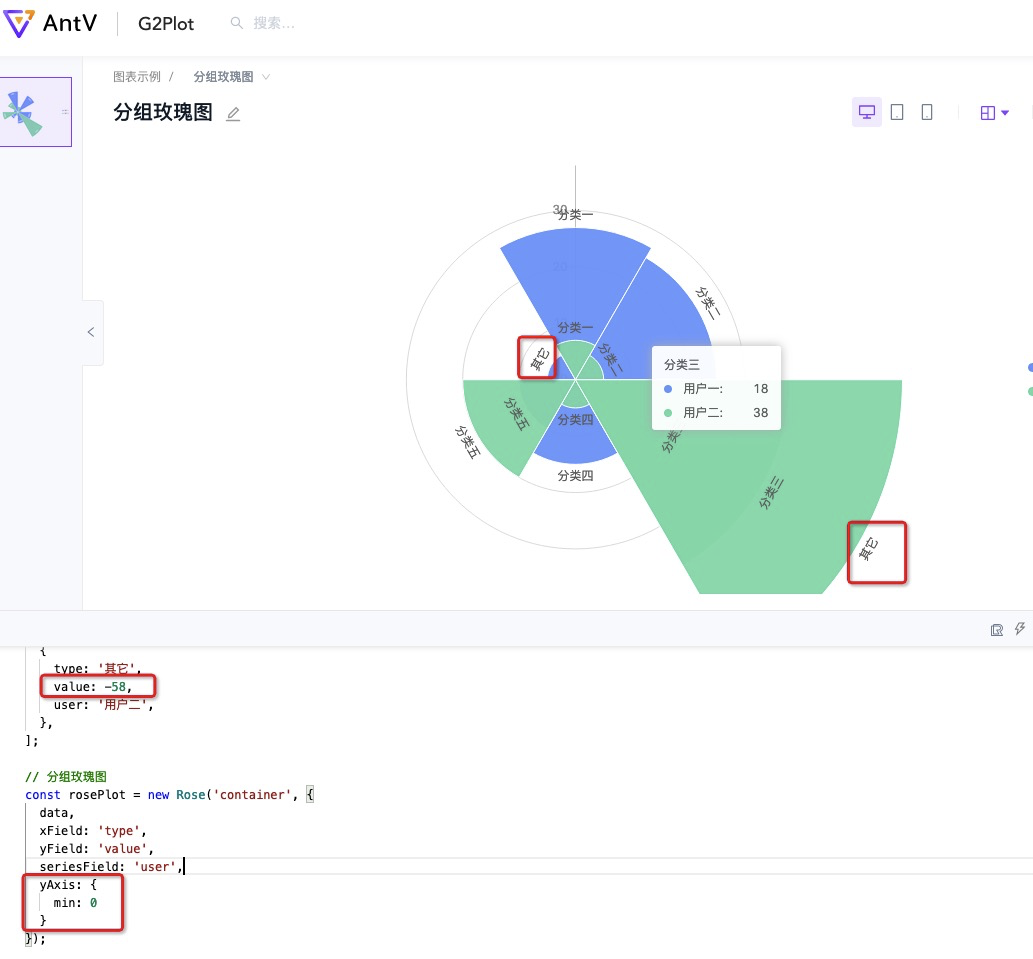
问题:当数据中存在负数时,会无视轴显示范围的设置。( 应该隐藏掉才对🤩 )
测试地址:https://antv-g2plot.gitee.io/zh/examples/rose/grouped#basic
测试数据:
```js
import { Rose } from '@antv/g2plot';
const data = [
{
type: '分类一',
value: 27,
user: '用户一',
},
{
type: '分类二',
value: 25,
user: '用户一',
},
{
type: '分类三',
value: 18,
user: '用户一',
},
{
type: '分类四',
value: 15,
user: '用户一',
},
{
type: '分类五',
value: 10,
user: '用户一',
},
{
type: '其它',
value: 5,
user: '用户一',
},
{
type: '分类一',
value: 7,
user: '用户二',
},
{
type: '分类二',
value: 5,
user: '用户二',
},
{
type: '分类三',
value: 38,
user: '用户二',
},
{
type: '分类四',
value: 5,
user: '用户二',
},
{
type: '分类五',
value: 20,
user: '用户二',
},
{
type: '其它',
value: -55,
user: '用户二',
},
];
// 分组玫瑰图
const rosePlot = new Rose('container', {
data,
xField: 'type',
yField: 'value',
isGroup: true,
// 当 isGroup 为 true 时,该值为必填
seriesField: 'user',
radius: 0.9,
label: {
offset: -15,
},
yAxis: {
min: 0
},
interactions: [
{
type: 'element-active',
},
],
});
rosePlot.render();
```
Contributor guide
Research direction
Reproduce the grouped Rose example at the linked test address using the provided data and yAxis min: 0 configuration. Trace the Rose chart’s axis-range and negative-value handling from its entry point, then verify that values below the configured range are hidden while valid grouped values remain visible.
Written by the indexing model from the issue text.
Assessment
- Tech stack
- typescript
- Domain
- data-visualization
- Issue type
- Bug
- Difficulty
- 3/5
- Estimated time
- 1-2 days
- Activity status
- Stale
- Clarity
- Mostly clear
- Newbie friendliness
- 38/100