cloud chart render error
- Dominant language
- JavaScript
- Stars
- 8k
- Forks
- 637
- PR merge metrics
- No merged PRs in 30d
Description
- [x] I have searched the [issues](https://github.com/antvis/f2/issues) of this repository and believe that this is not a duplicate.
### Reproduction link
[](https://codesandbox.io/s/f2-tag-cloud-error-8506w?fontsize=14&hidenavigation=1&theme=dark)
### Steps to reproduce
Refresh the page repeatedly
### What is expected?
Chart rendering Correctly
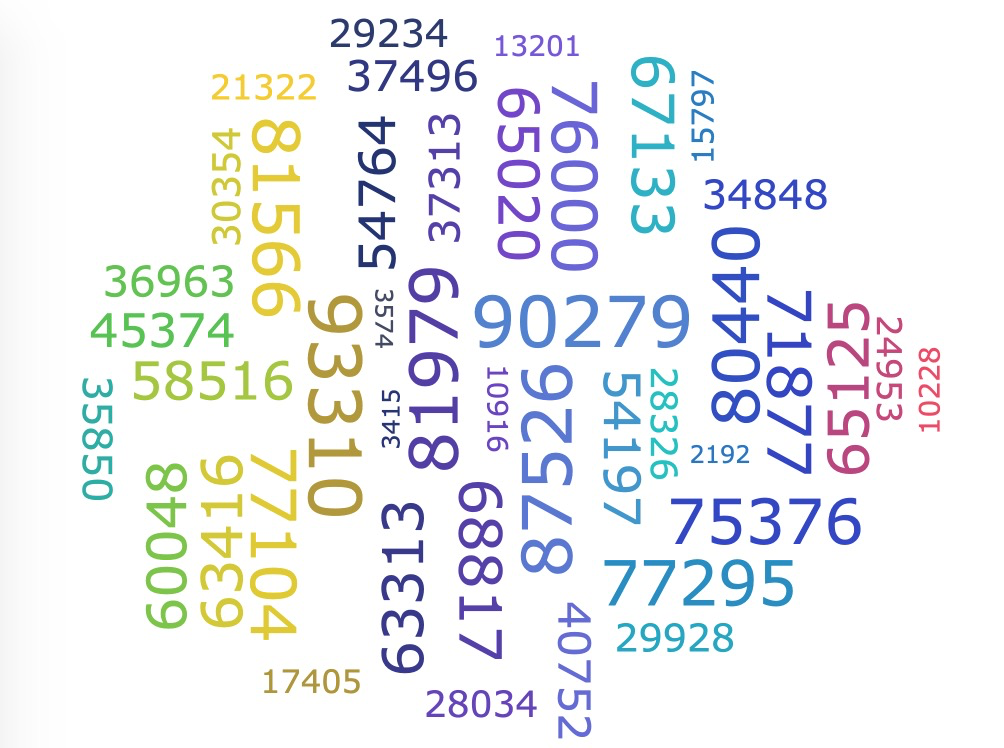
### What is actually happening?
Probability js error: Cannot read property '0' of undefined

| Environment | Info |
|---|---|
| f2 | 3.6.3 |
| System | macOS 10.15.5 |
| Browser | Google Chrome 83.0.4103.61 |
---
```js
_proto.scale = function scale(value) {
if (isNil(value)) {
return NaN;
}
var max = this.max;
var min = this.min;
if (max === min) {
return 0;
}
var percent = (value - min) / (max - min);
var rangeMin = this.rangeMin();
var rangeMax = this.rangeMax();
return rangeMin percent * (rangeMax - rangeMin);
}
```
```js
// Get the interpolation between colors
function getValue(start, end, percent, index) {
var value = start[index] (end[index] - start[index]) * percent;
return value;
} // convert to hex
```

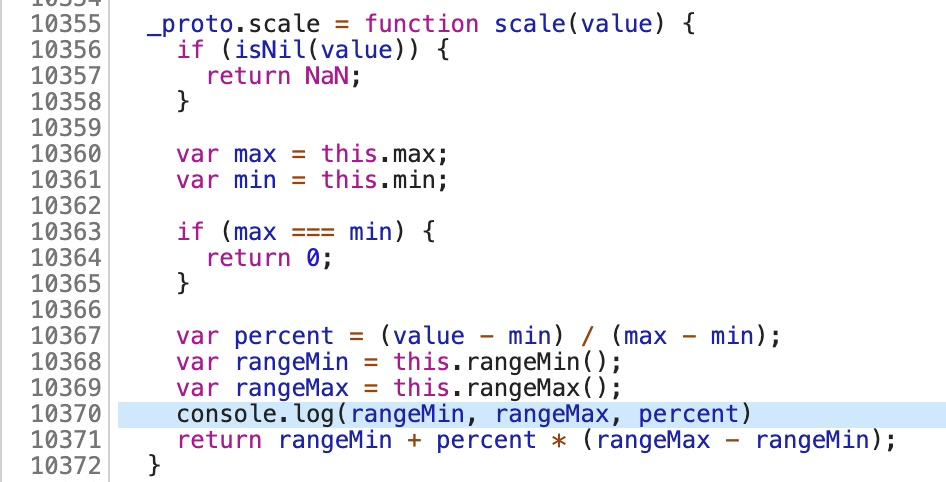

'percent' should not be negative.
It's normal '@antv/f2@3.3.7'.
Contributor guide
Research direction
Start with the linked CodeSandbox reproduction and refresh the page repeatedly to observe the intermittent rendering failure. Read the shown _proto.scale and getValue snippets, then trace why the color interpolation receives an undefined value or a negative percent; done means the chart renders correctly without the reported JavaScript error.
Written by the indexing model from the issue text.
Assessment
- Tech stack
- javascript
- Domain
- data-visualization
- Issue type
- Bug
- Difficulty
- 3/5
- Estimated time
- 1-2 days
- Activity status
- Stale
- Clarity
- Mostly clear
- Newbie friendliness
- 42/100