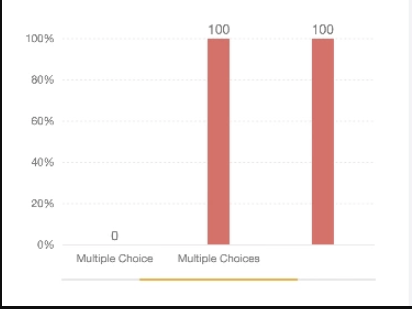
柱状图出现滚动条不显示后面的数据?
- Dominant language
- JavaScript
- Stars
- 8k
- Forks
- 637
- PR merge metrics
- No merged PRs in 30d
Description
> 出现滚动条后、只能显示values的前几位,请问一下 怎么设置出现滚动条,并且全部显所有的数据??!
**data 是元数据**
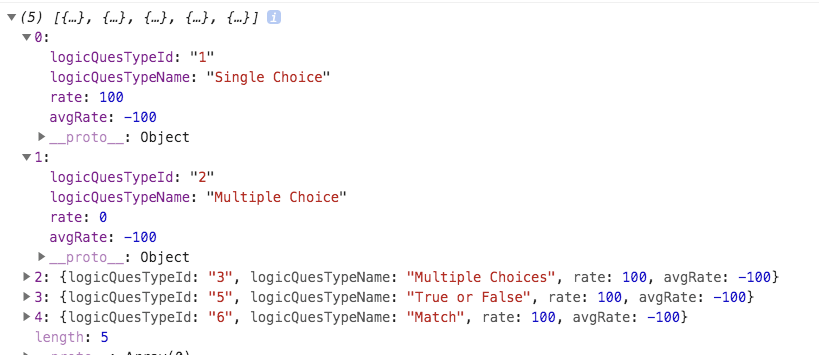
**config 是显示的索引**
`
config = {
difficulty: {
tickCount: 5,
values
}
};
`
**values**
` ["Single Choice", "Multiple Choice", "Multiple Choices"] `
**配置柱状图**
`chart.source(data, config);`
**配置滚动条**
`
chart.scrollBar({
mode: 'x',
xStyle: {
backgroundColor: '#e8e8e8',
fillerColor: '#FFAA0A',
size: 2,
offsetY:0 // 0: 无legend的情况, -40 有
}
});
chart.interaction('pan');
`
[问题详情请看](https://segmentfault.com/q/1010000021628139)
Contributor guide
Research direction
Start with the chart.scrollBar({ mode: 'x' }) and chart.interaction('pan') configuration shown in the issue, then reproduce the bar chart using the supplied data, config, and values. Done means the horizontal scrollbar and pan interaction allow all category values to be displayed rather than only the first few.
Written by the indexing model from the issue text.
Assessment
- Tech stack
- javascript
- Domain
- data-visualization
- Issue type
- Bug
- Difficulty
- 3/5
- Estimated time
- 1-2 days
- Activity status
- Stale
- Clarity
- Mostly clear
- Newbie friendliness
- 35/100