使用某基金近一个月业绩走势折线图事例,value值相近时会出现Y轴最上面出现重叠数字。
- Dominant language
- JavaScript
- Stars
- 8k
- Forks
- 637
- PR merge metrics
- No merged PRs in 30d
Description
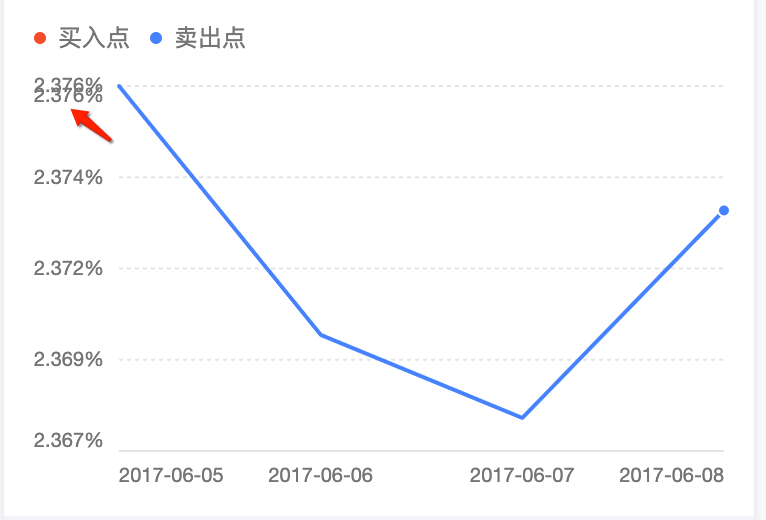
附上我修改的代码部分
var data = [{
date: "2017-06-05",
value: 2.376,
tag: 0
}, {
date: "2017-06-06",
value: 2.37,
tag: 0
}, {
date: "2017-06-07",
value: 2.368,
tag: 0
}, {
date: "2017-06-08",
value: 2.373,
tag: 2
}];
chart.source(data, {
value: {
tickCount: 4,
formatter: function formatter(val) {
return val.toFixed(3) + '%';
}
},
date: {
type: 'timeCat',
range: [0, 1],
tickCount: 3
}
});
Contributor guide
Research direction
Reproduce the overlap with the data and chart.source configuration shown in the issue, including value.tickCount and the three-decimal formatter. Start by tracing the Y-axis tick-label rendering for closely spaced values. Done means the chart displays distinct, non-overlapping labels for this example without losing the intended tick formatting.
Written by the indexing model from the issue text.
Assessment
- Tech stack
- javascript
- Domain
- data-visualization
- Issue type
- Bug
- Difficulty
- 3/5
- Estimated time
- 1-2 days
- Activity status
- Stale
- Clarity
- Mostly clear
- Newbie friendliness
- 38/100