类似于甘特图的图表标签显示及图表滑动问题
- Dominant language
- JavaScript
- Stars
- 8k
- Forks
- 637
- PR merge metrics
- No merged PRs in 30d
Description
* **F2 Version**: 3.3.8
* **Platform**: iOS
* **Mini Showcase(like screenshots)**:
* **CodePen Link**:
1、https://codepen.io/qcasxy/pen/JqaYxy
2、https://codepen.io/qcasxy/pen/GaXpbw
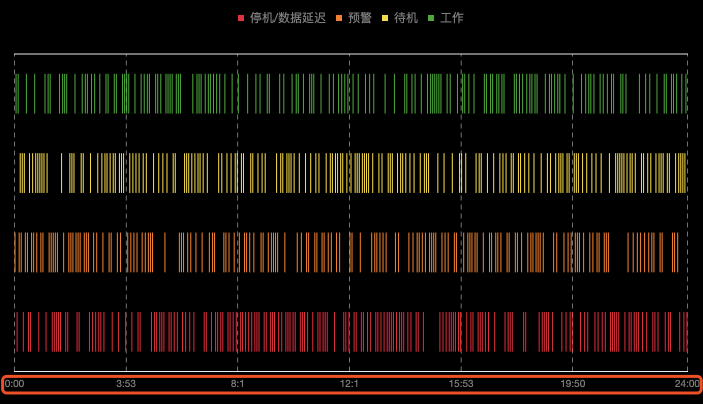
由于项目需要我正在用F2做一个展示设备全天详细运行状态的图表,图表的数据绑定及基本样式已经初步完成,但还存在一些细节方面的问题。
问题一:
我尝试了使用`linear`和`timeCat`两种度量类型来定义X轴:
(1)当我使用`timeCat`时X轴上的时间标签无法均匀分布。设置`ticks`后无法正常显示标签。
(2)当我使用`linear`时必须使用`tickInterval: 14400`或设置`ticks`才能使刻度均匀分布, 使用`tickCount: 7`刻度间隔会是15000(若均匀分布应该是14400,我已经设置了`nice: false`)。
不知道使用`timeCat`是否可以实现刻度均匀分布。
(代码链接:https://codepen.io/qcasxy/pen/JqaYxy )
问题二:
在使用`linear`的度量类型的基础上我尝试添加缩放手势。我设置了最小缩放倍数和最大缩放倍数,但实际效果会使原本四条数据变为1~3条,具体效果见下图:
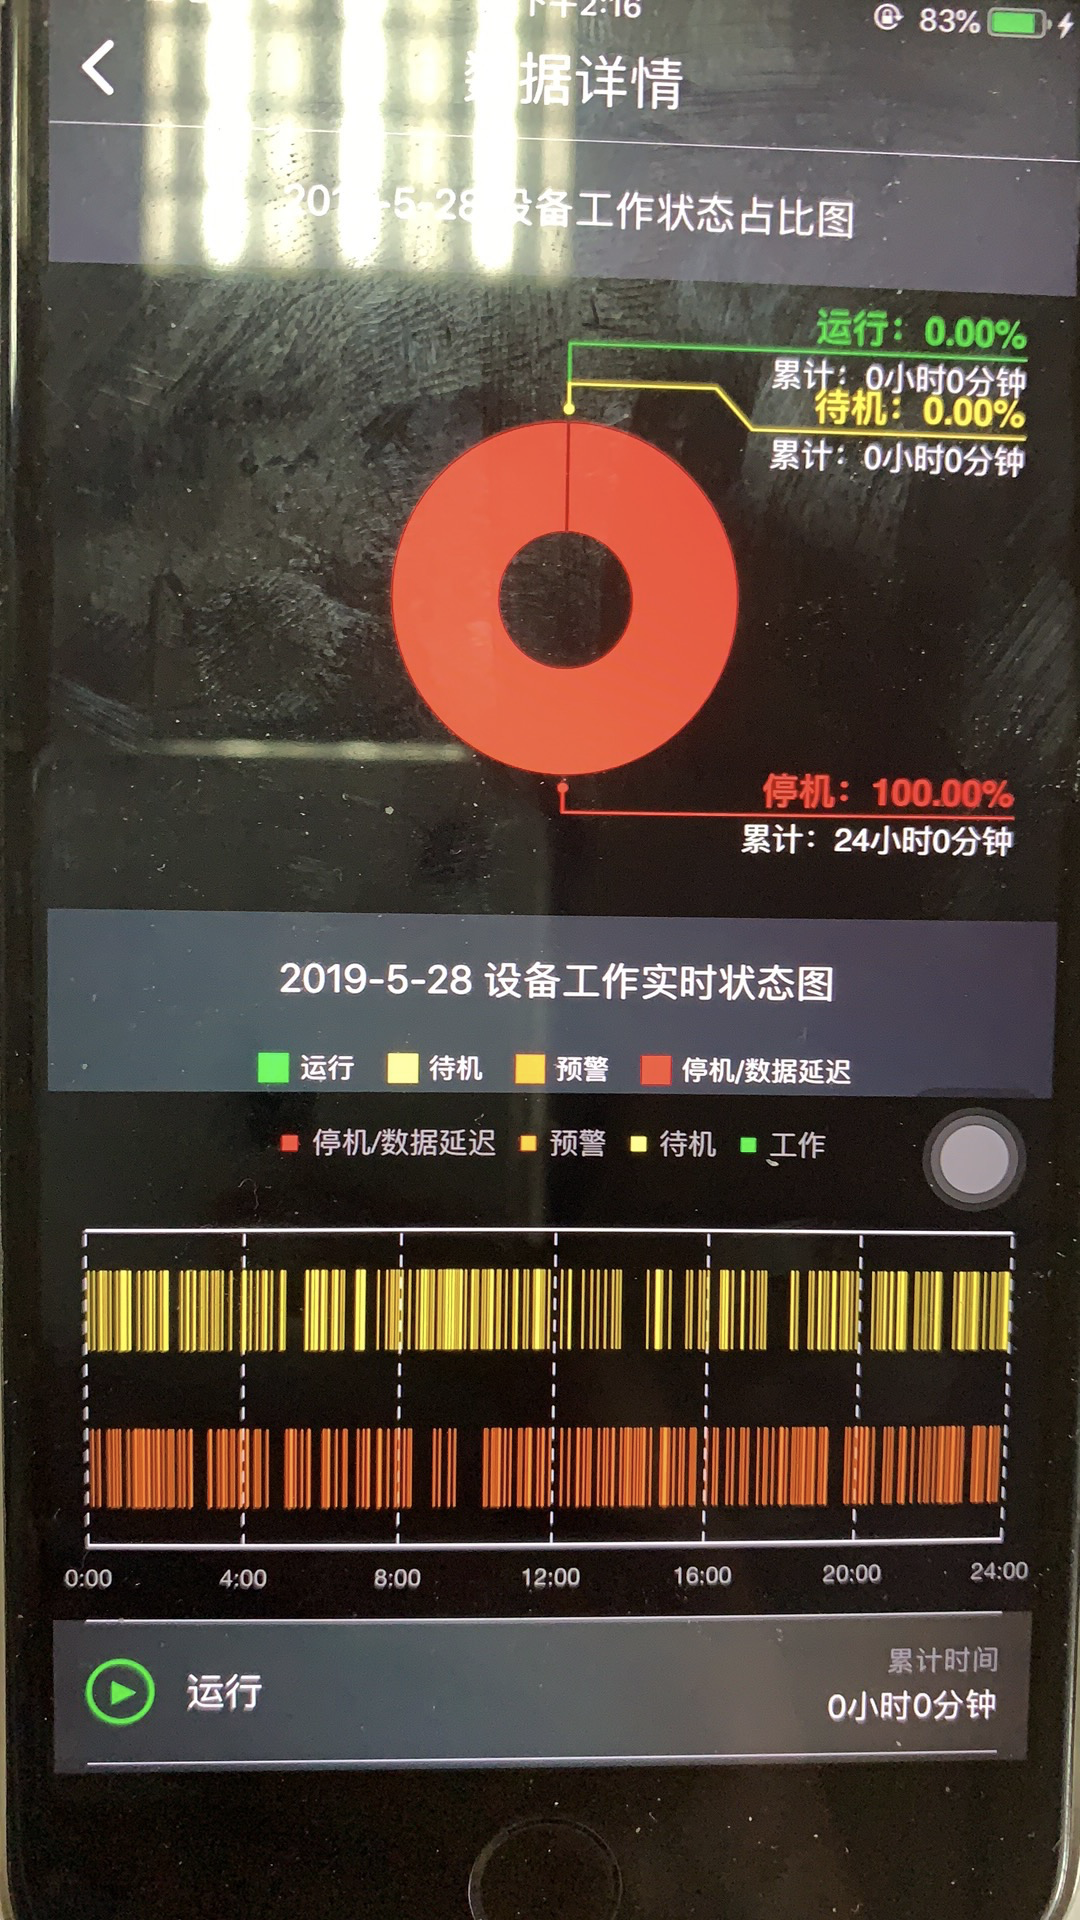
(代码链接:https://codepen.io/qcasxy/pen/GaXpbw )
问题三:
在使用`linear`的度量类型的基础上我尝试添加平移/快扫手势。我设置了`limitRange`但是始终显示完整的数据,无法实现平移的功能。(代码链接:https://codepen.io/qcasxy/pen/GaXpbw )
Contributor guide
Research direction
Start with the two CodePen reproductions, JqaYxy and GaXpbw, using F2 3.3.8 on iOS. Inspect the timeCat and linear scale settings, then the zoom, pan, and limitRange configuration. Done means the time labels distribute as intended and zooming or panning respects the configured data and range limits.
Written by the indexing model from the issue text.
Assessment
- Tech stack
- javascript
- Domain
- data-visualization, mobile
- Issue type
- Bug
- Difficulty
- 4/5
- Estimated time
- 3-5 days
- Activity status
- Stale
- Clarity
- Mostly clear
- Newbie friendliness
- 25/100