配置以时间为X轴的折线图,设置Interaction和滚动条出现 Cannot read property '0' of undefined的错误
- Dominant language
- JavaScript
- Stars
- 8k
- Forks
- 637
- PR merge metrics
- No merged PRs in 30d
Description
* **F2 Version** : 3.3.4
* **Platform**: windows 8.1
* **Mini Showcase(like screenshots)**:
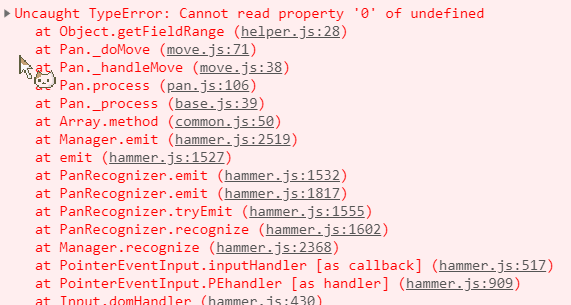
刚渲染的时候有values值 图表显示也正常
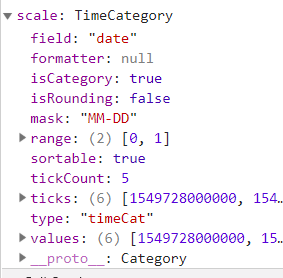
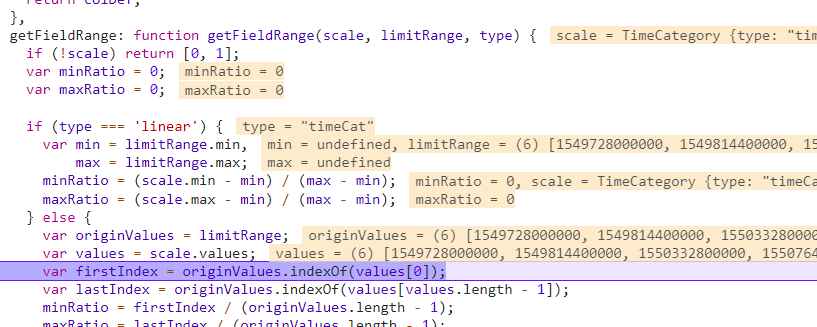
滑动之后就显示为undefined了

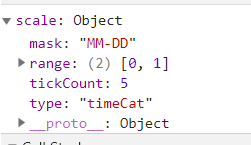
代码如下:
    chart.scale('date', { type: 'timeCat', tickCount: 5,mask: 'MM-DD',range: [0, 1]});

    chart.scale('value', { type: 'linear', min: 0, max: 100, tickCount: 5 });

    chart.interaction('pan');

    chart.scrollBar({

      mode: 'x',

      xStyle: {

        offsetY: -5,

      },

    });
* **CodePen Link**: 暂无
Contributor guide
Research direction
Start by reproducing the issue with the provided timeCat scale, pan interaction, and x-axis scrollBar configuration. Trace the pan and scrollbar behavior after scrolling, then verify that the chart values remain defined and no “Cannot read property '0' of undefined” error appears.
Written by the indexing model from the issue text.
Assessment
- Tech stack
- javascript
- Domain
- data-visualization
- Issue type
- Bug
- Difficulty
- 3/5
- Estimated time
- 1-2 days
- Activity status
- Stale
- Clarity
- Mostly clear
- Newbie friendliness
- 35/100