uniapp 在使用F2插件时柱状图文字冲突
- Dominant language
- JavaScript
- Stars
- 8k
- Forks
- 637
- PR merge metrics
- No merged PRs in 30d
Description
{{timename}}清洁燃气用量概览 单位( 罐 )
import F2 from '@/components/l-f2/f2-all.min.js';
export default {
data() {
return {
info:'',
timenum:0,
timename:'本周',
timetype:[{
num:0,name:'本周',
},{
num:1,name:'本月',
},{
num:2,name:'上半年',
},{
num:3,name:'一年',
}],
data : [{
year: '',
sales: ''
}]
}
},
onShow() {
this.sel()
},
methods: {
// 获取不同时间段的数据
type(v){
this.timenum=v.num;
this.timename=v.name;
this.sel();
},
async sel(){
let res= await this.$myRequest({
url:'/admin/sale/bot_user_sel',
method:'POST',
data:{
top_id:uni.getStorageSync('id'),slot:this.timenum
},
})
this.info=res.info;
this.data=res.data;
this.$refs.chart.reset(chart => {
chart.clear(); // 清理所有
chart.source(this.data); // 加载新数据
chart.interval().position('year*sales'); // 重新定义图形语法
chart.render();
// 绘制柱状图文本
const offset = -5;
const canvas = chart.get('canvas');
const group = canvas.addGroup();
this.data.forEach(function(obj) {
const point = chart.getPosition(obj);
group.addShape('text', {
attrs: {
x: point.x,
y: point.y + offset,
text: obj.sales,
textAlign: 'center',
textBaseline: 'bottom',
fill: '#808080'
}
});
});
return chart;
})
}
},
// 组件数据
mounted() {
this.$refs.chart.init(config => {
const chart = new F2.Chart(config);
chart.source(this.data, {
sales: {
tickCount: 5
}
});
chart.tooltip(false);
chart.interval().position('year*sales');
chart.render();
// 绘制柱状图文本
const offset = -5;
const canvas = chart.get('canvas');
const group = canvas.addGroup();
this.data.forEach(function(obj) {
const point = chart.getPosition(obj);
group.addShape('text', {
attrs: {
x: point.x,
y: point.y + offset,
text: obj.sales,
textAlign: 'center',
textBaseline: 'bottom',
fill: '#808080'
}
});
});
return chart;
});
}
}
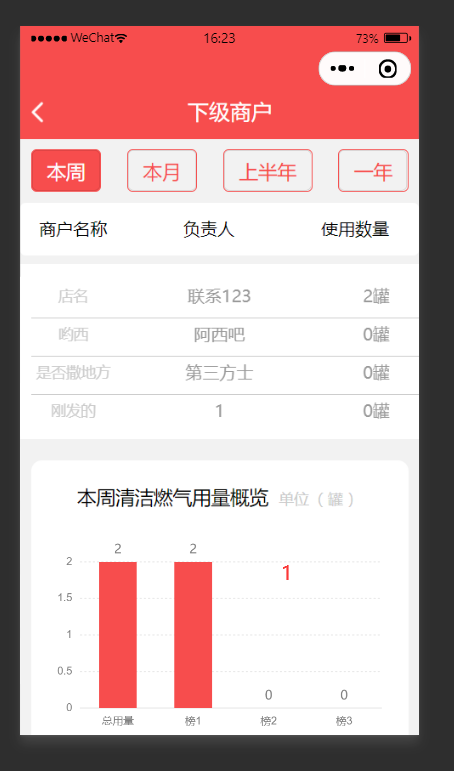
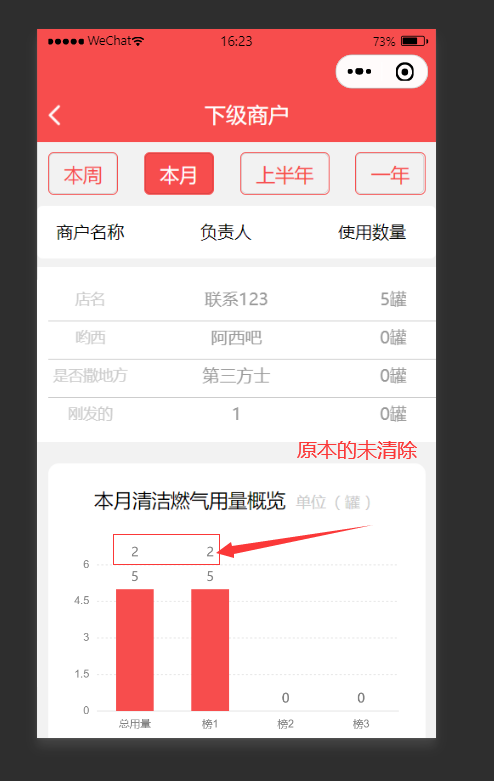
求解答,如何使第二次获取数据后,把前一个柱状图的文字清除,只清除上一次的,本次的要保留
Contributor guide
Research direction
Start at the mounted() chart initialization and the sel() refresh callback, especially the this.$refs.chart.init and reset entry points. Trace how each canvas group and text shape is created across the first render and subsequent data loads. Done means the previous value labels are removed when data is refreshed while the current chart's labels remain visible.
Written by the indexing model from the issue text.
Assessment
- Tech stack
- javascript
- Domain
- data-visualization
- Issue type
- Bug
- Difficulty
- 4/5
- Estimated time
- 3-5 days
- Activity status
- Stale
- Clarity
- Mostly clear
- Newbie friendliness
- 30/100