F2柱状图y轴最小值和最大值相差过大时,最小值会展示不出来,变成了y零刻度线
- Dominant language
- JavaScript
- Stars
- 8k
- Forks
- 637
- PR merge metrics
- No merged PRs in 30d
Description
- [ ] I have searched the [issues](https://github.com/antvis/f2/issues) of this repository and believe that this is not a duplicate.
### Reproduction link
[https://antv-2018.alipay.com/zh-cn/f2/3.x/demo/bar/dodge-column.html](https://antv-2018.alipay.com/zh-cn/f2/3.x/demo/bar/dodge-column.html)
### Steps to reproduce
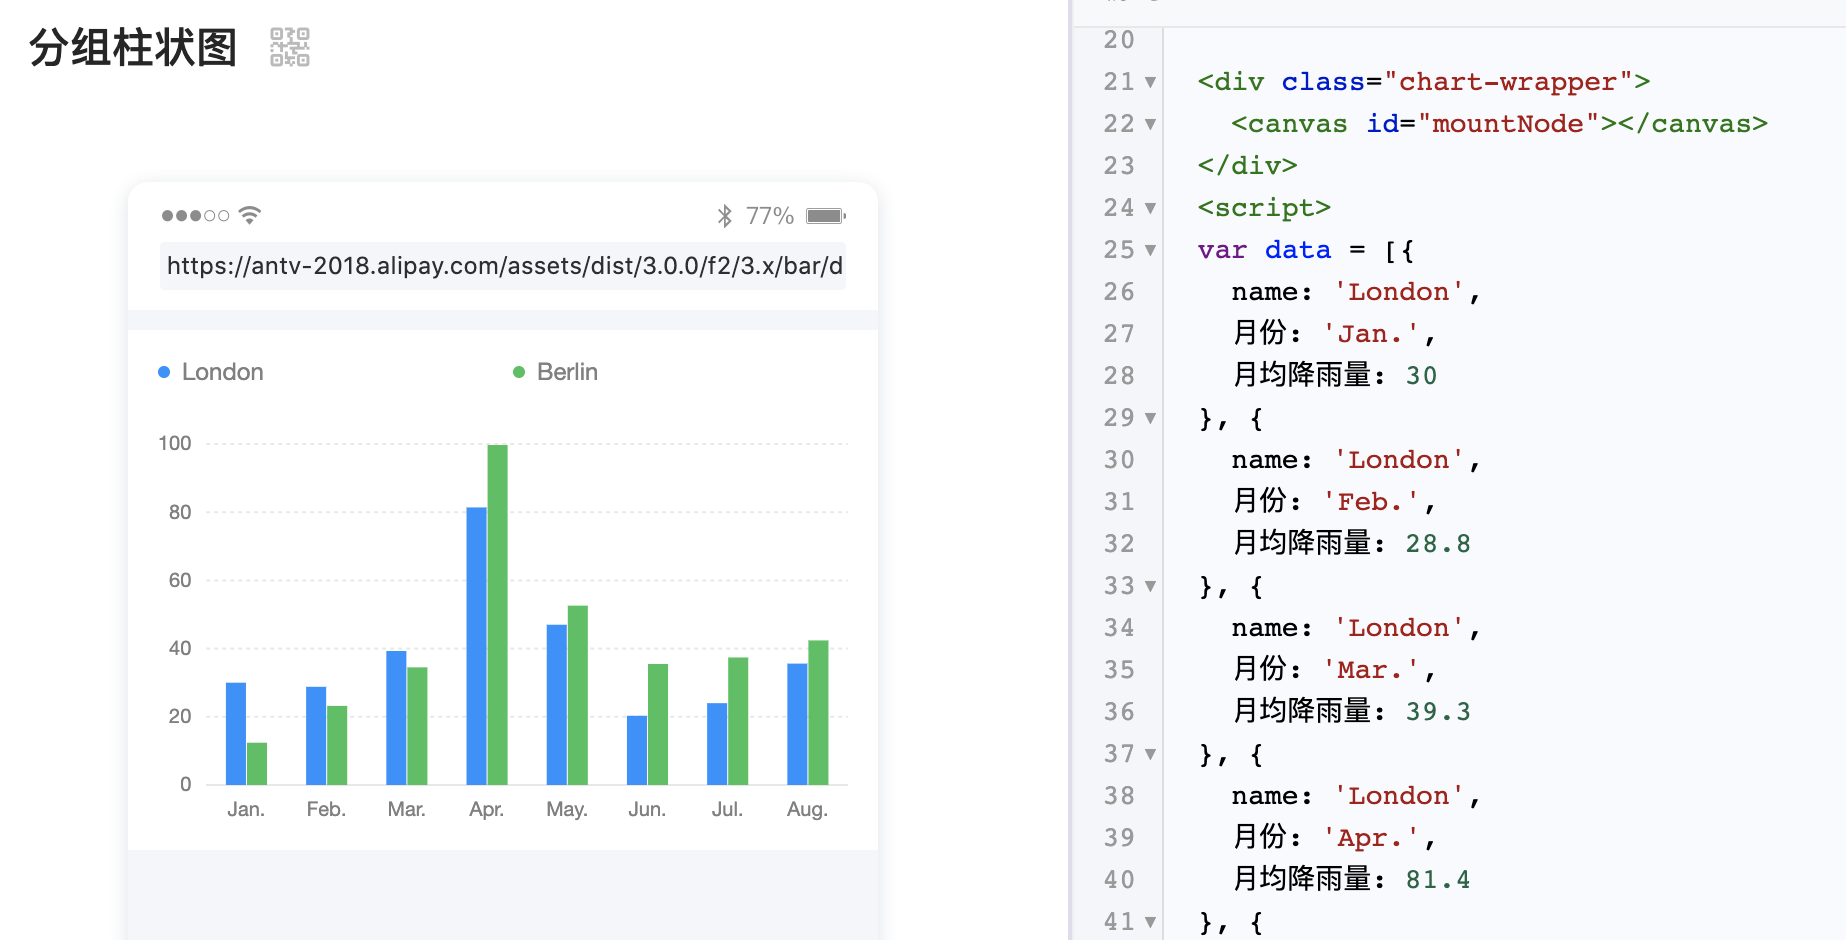
上图为正常的分组柱状图
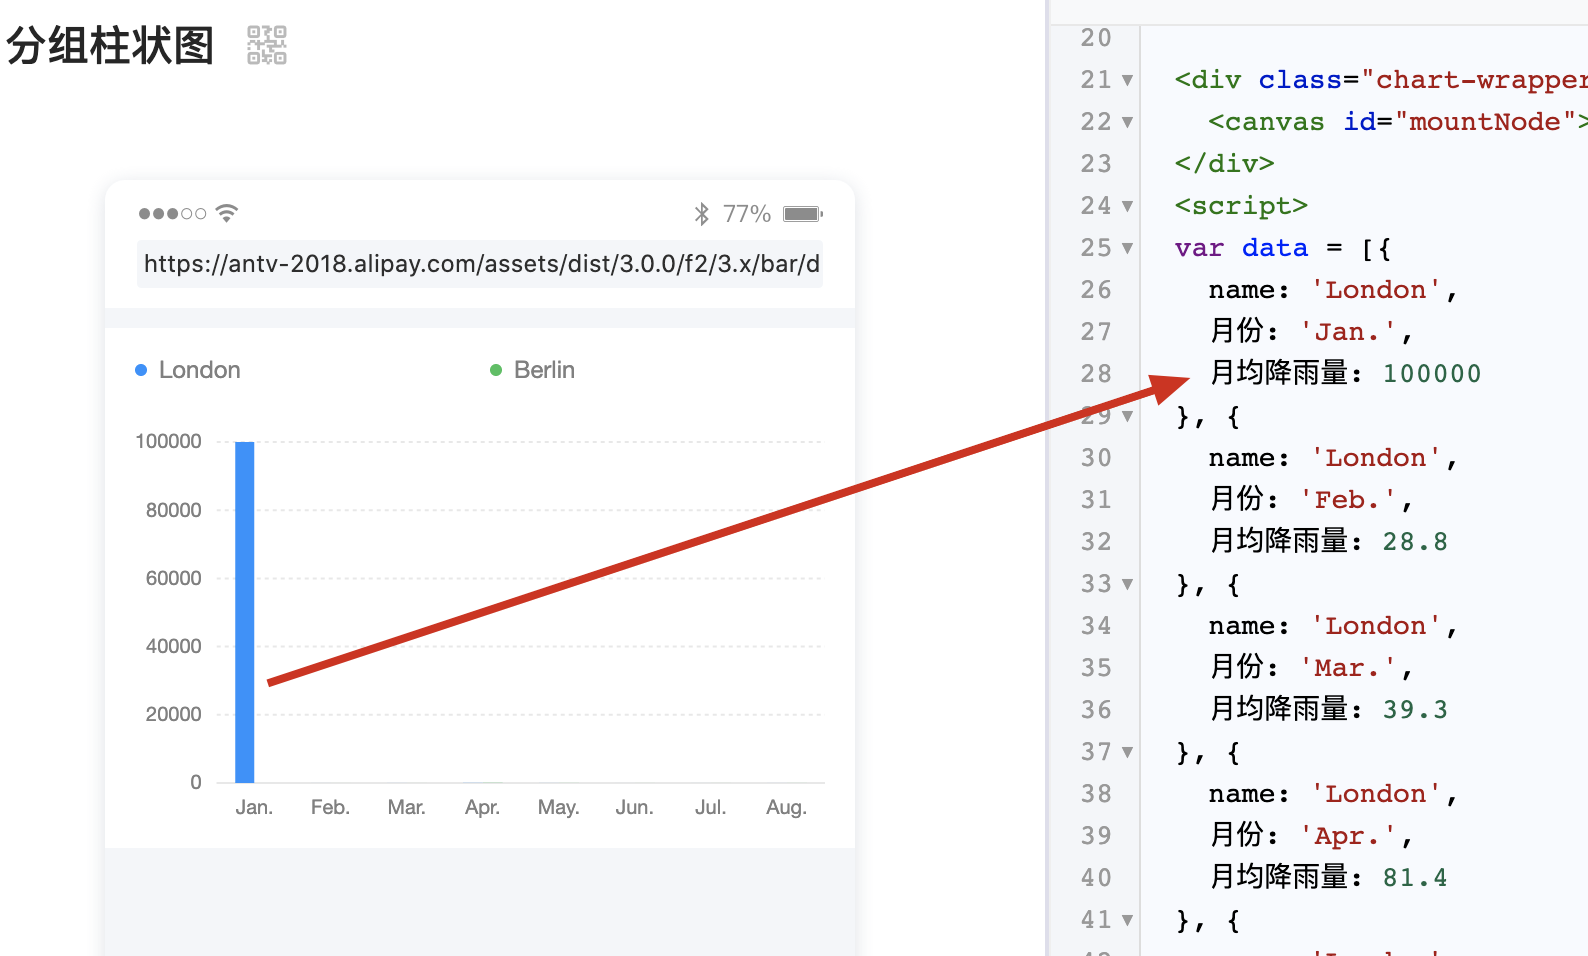
上图体现出若某个单位值过大时,其他的值展现则成了零
| Environment | Info |
|---|---|
| f2 | 3.7.7 |
| System | - |
| Browser | - |
Contributor guide
Research direction
Start with the linked dodge-column reproduction in F2 3.7.7 and compare the normal grouped-column case with the case containing one much larger value. Trace how the chart computes and renders the y-axis range and identify where smaller values become the zero tick. Done means the smaller values remain visible in the reproduction without breaking the normal case.
Written by the indexing model from the issue text.
Assessment
- Tech stack
- javascript
- Domain
- data-visualization
- Issue type
- Bug
- Difficulty
- 3/5
- Estimated time
- 1-2 days
- Activity status
- Stale
- Clarity
- Mostly clear
- Newbie friendliness
- 35/100