F2柱状图y轴最小值和最大值相差过大时,最小值会展示不出来,变成了y零刻度线
- Dominant language
- JavaScript
- Stars
- 8k
- Forks
- 637
- PR merge metrics
- No merged PRs in 30d
Description
The issue which is not created via https://antv-issue-helper.surge.sh will be closed immediately.
---
注意:不是用 https://antv-issue-helper.surge.sh 创建的 issue 会被立即关闭。
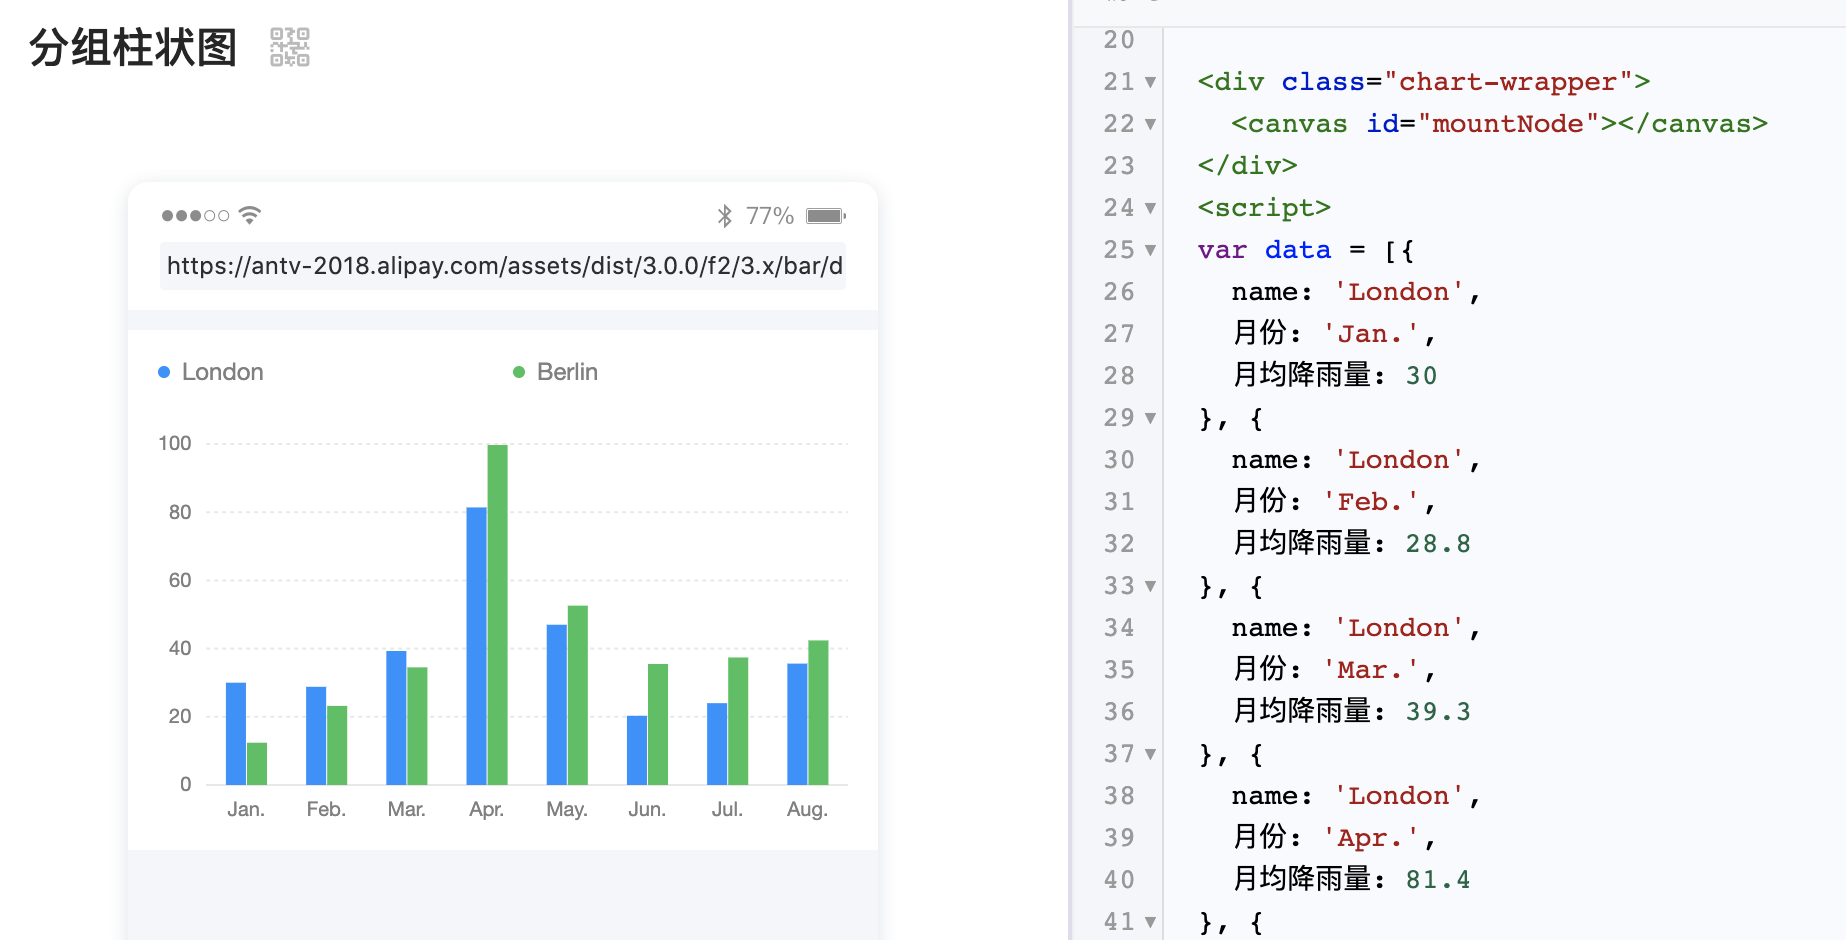
上图为正常的分组柱状图
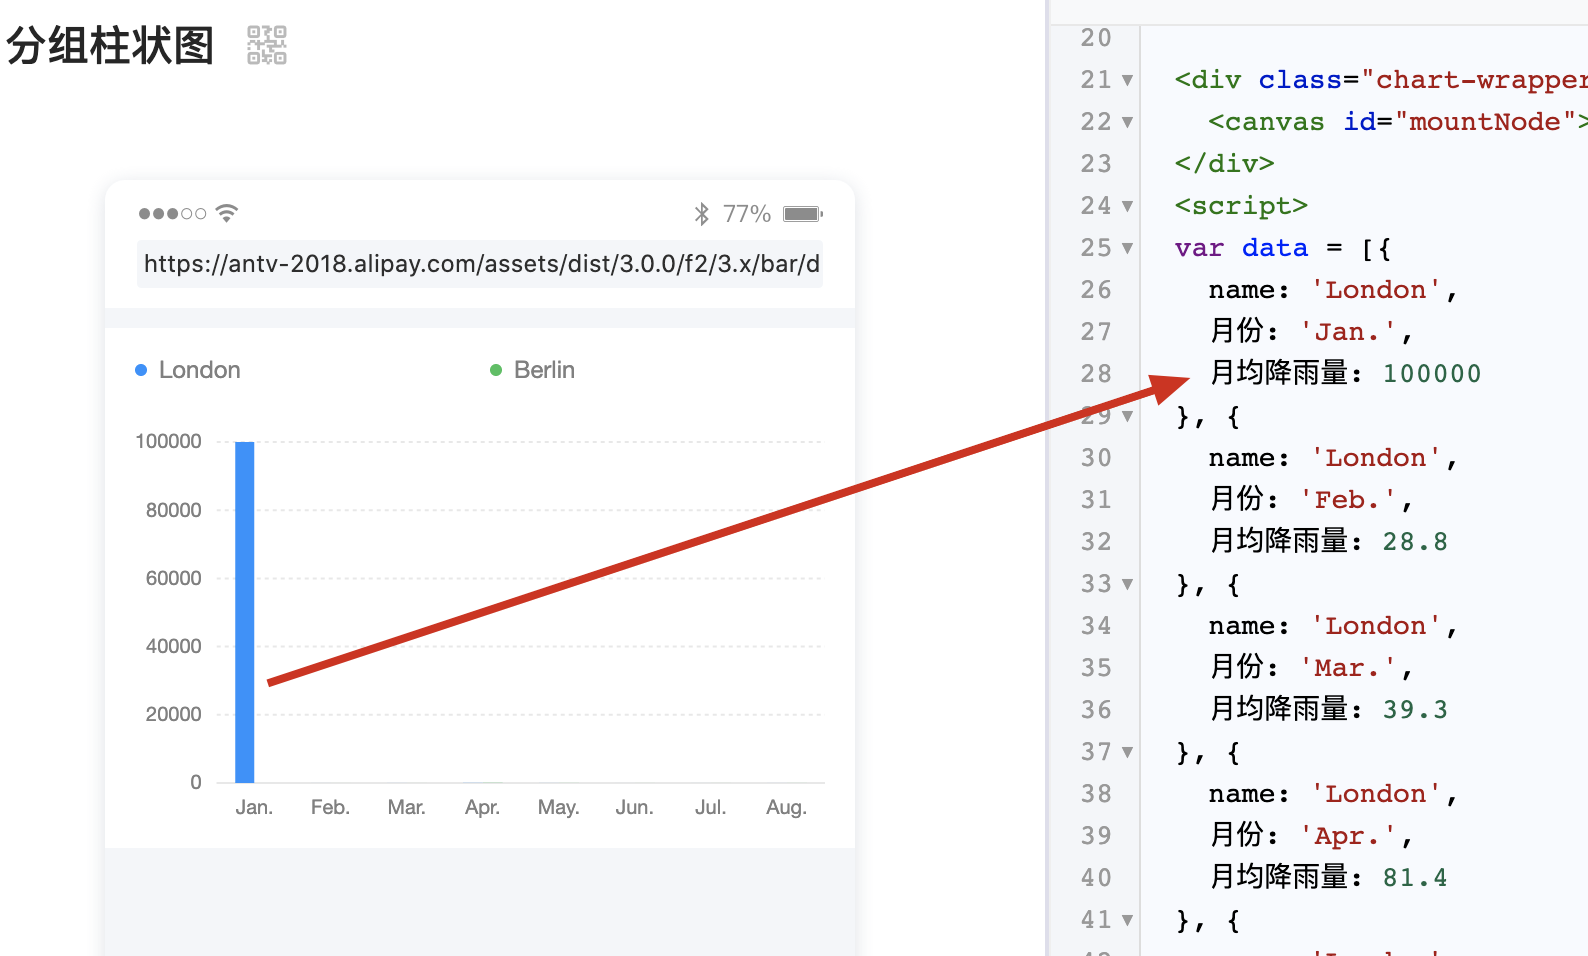
上图体现出若某个单位值过大时,其他的值展现则成了零
"@antv/f2": "^3.7.7"
Contributor guide
Research direction
Start by reproducing the grouped bar chart behavior described in the issue with @antv/f2 version ^3.7.7, using the two screenshots as the expected comparison. Trace the y-axis scaling and rendering behavior; done means small values remain visibly distinct from the zero tick when one value is much larger.
Written by the indexing model from the issue text.
Assessment
- Tech stack
- javascript
- Domain
- data-visualization
- Issue type
- Bug
- Difficulty
- 3/5
- Estimated time
- 1-2 days
- Activity status
- Stale
- Clarity
- Needs clarification
- Newbie friendliness
- 35/100