折线图绘制不准确
Open
- Dominant language
- JavaScript
- Stars
- 8k
- Forks
- 637
- PR merge metrics
- No merged PRs in 30d
Description
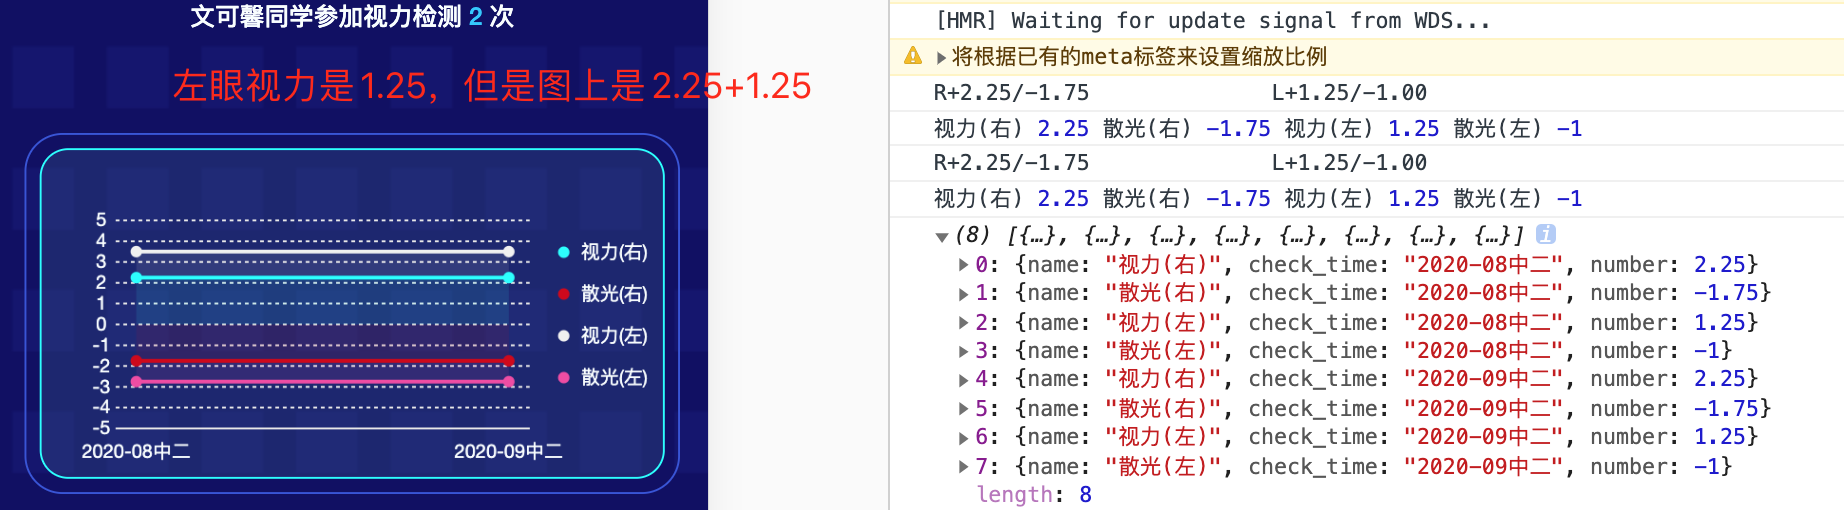
数值在累加
Contributor guide
Research direction
Start with the attached screenshot and reproduce the line chart using data that causes the values to accumulate. No file or test is named, so trace the chart-rendering entry point and compare plotted points with the source values; done means the line chart displays the intended values accurately.
Written by the indexing model from the issue text.
Assessment
- Tech stack
- javascript
- Domain
- data-visualization
- Issue type
- Bug
- Difficulty
- 4/5
- Estimated time
- 3-5 days
- Activity status
- Stale
- Clarity
- Needs clarification
- Newbie friendliness
- 20/100