ampproject / ampproject/worker-dom
Performance / React
- Dominant language
- TypeScript
- Stars
- 3.3k
- Forks
- 154
- PR merge metrics
- No merged PRs in 30d
Description
Was just taking this library for a spin with an medium size react app, just to see how well it runs. With some patching I got it rendering, but I was sad to find it significantly slower than running on the main thread:
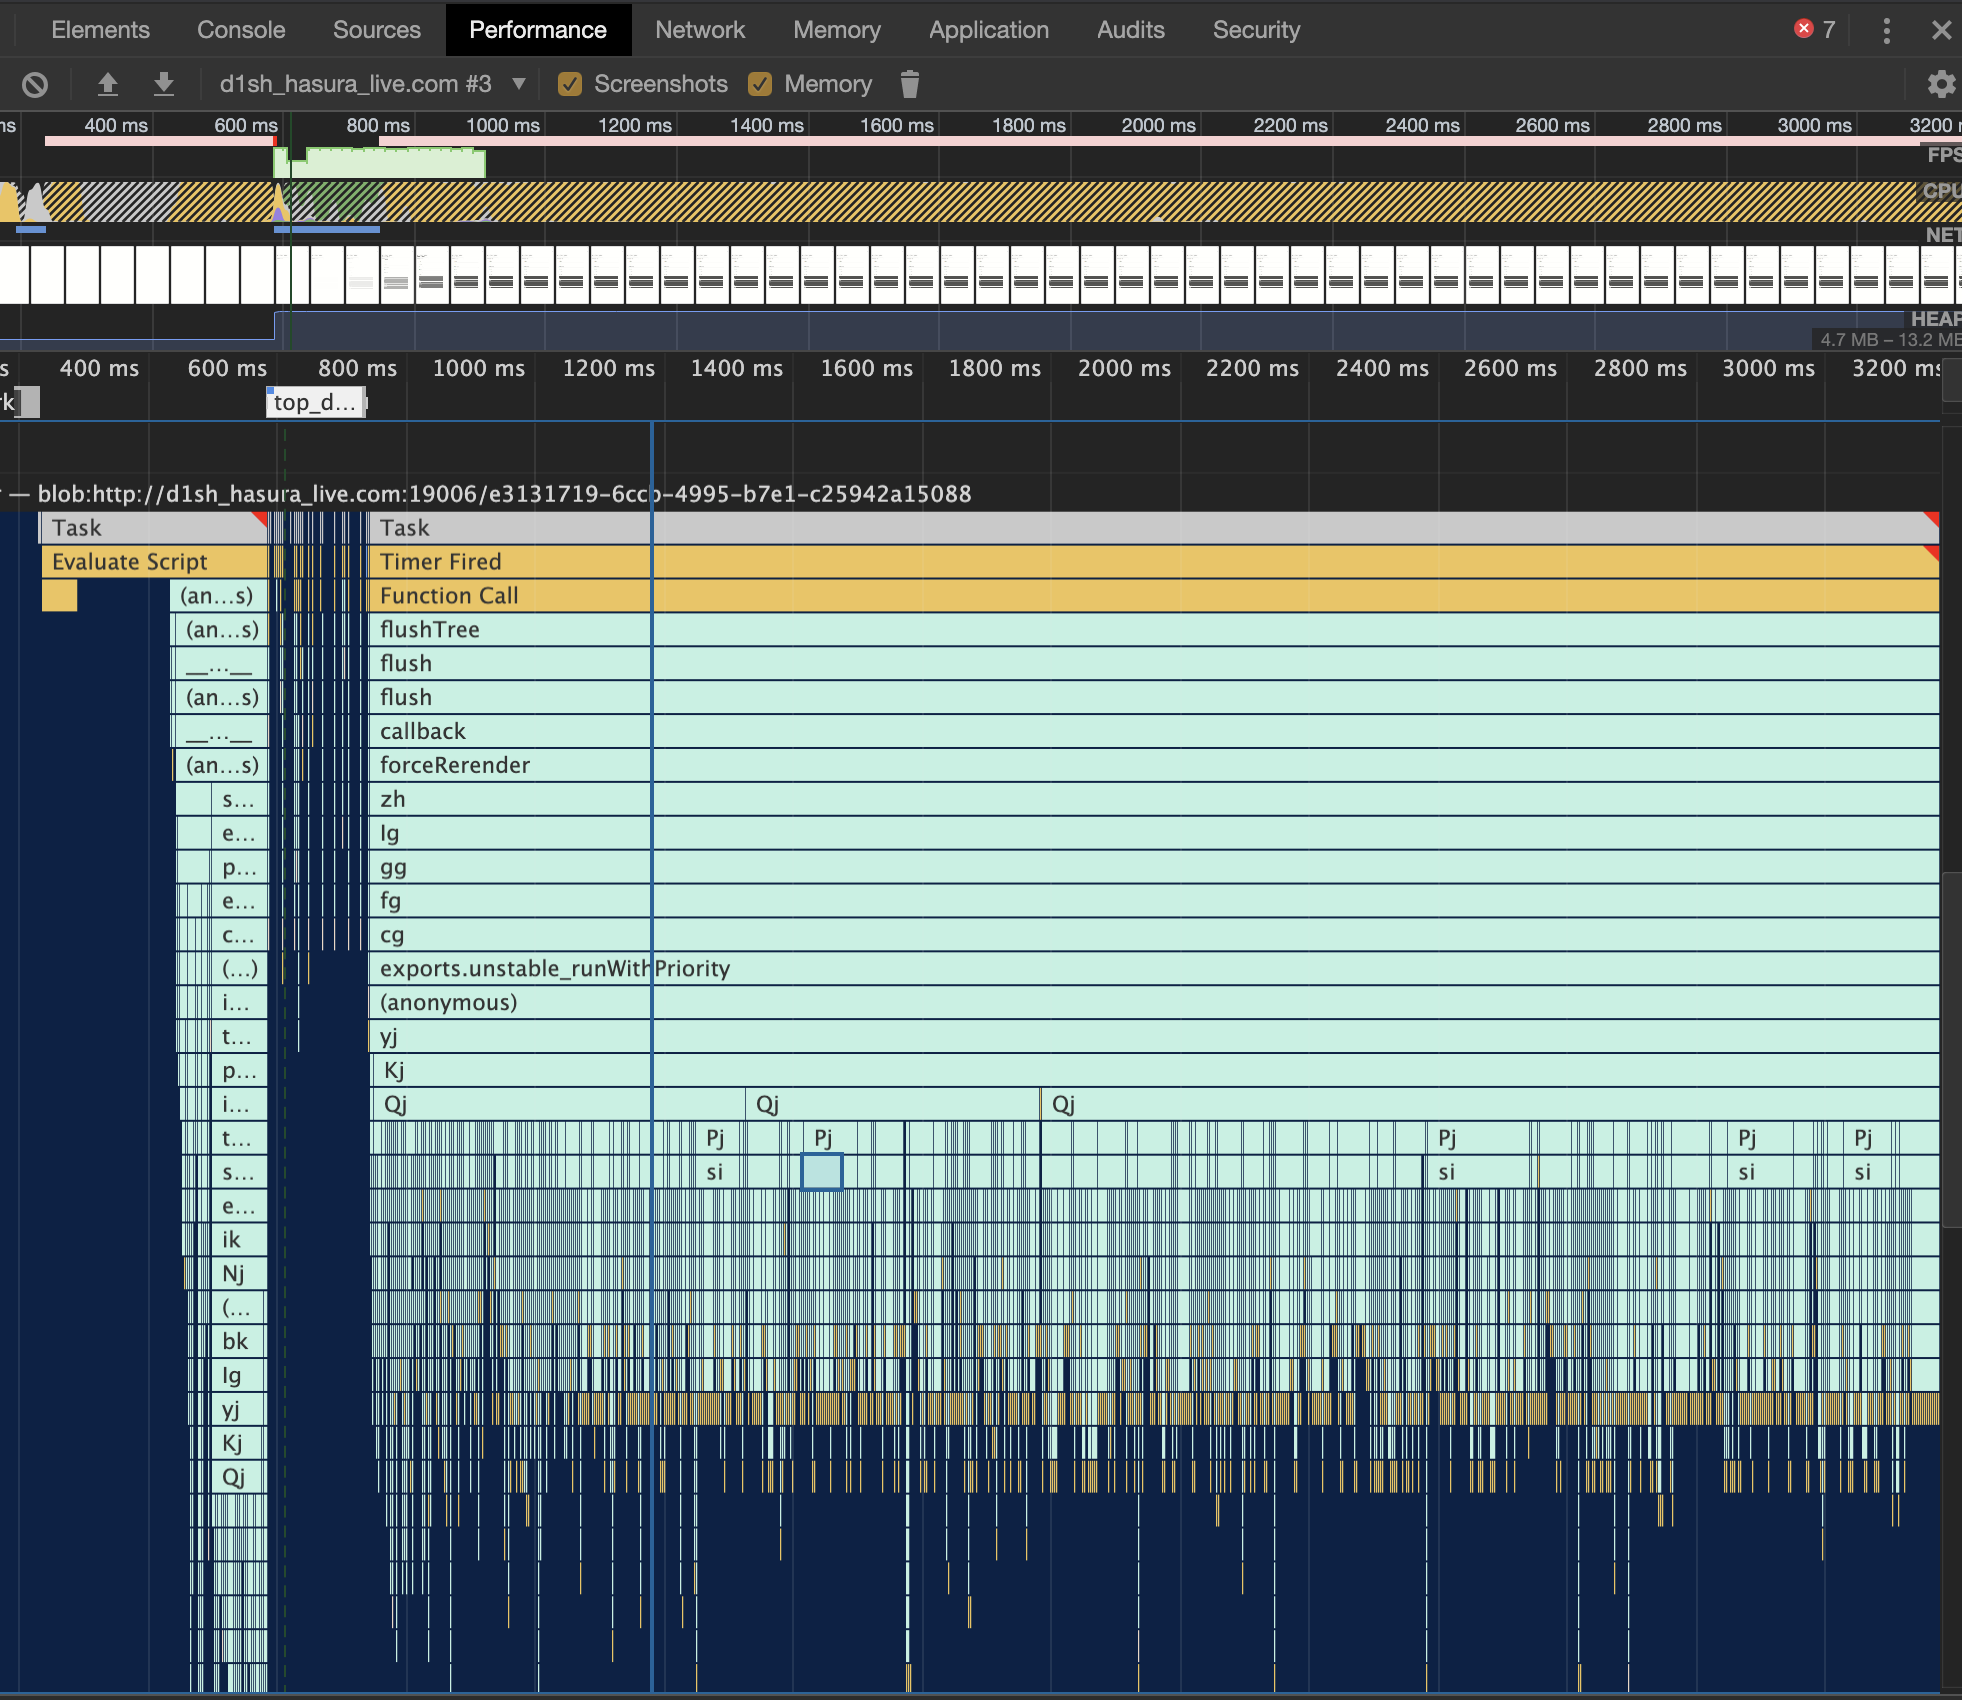
When zoomed in:

As you can see some setProperty calls are taking 15ms and the total for that render is about 2.5s, whereas on the main thread I get a total render time close to 200ms.
Heap:
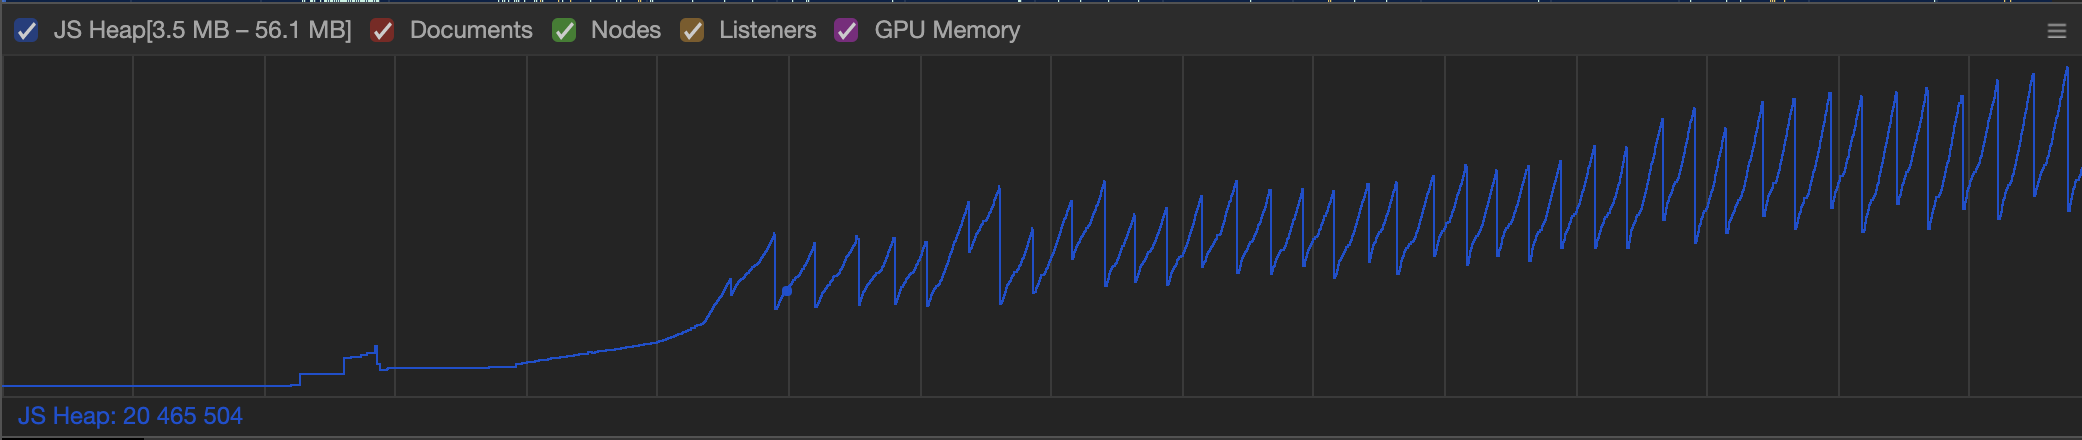
Just curious - does this level of slowdown/overhead make sense when dealing with larger renders, or am I running into a memory or other issue?
Contributor guide
Research direction
Reproduce the report with a medium-sized React app and compare worker rendering with main-thread rendering. Profile the reported setProperty calls and heap usage, then determine whether the slowdown is expected overhead or indicates a memory or other issue. Done means the cause is supported by measurements and the performance behavior is explained.
Written by the indexing model from the issue text.
Assessment
- Tech stack
- react
- Domain
- frontend, performance
- Issue type
- Bug
- Difficulty
- 5/5
- Estimated time
- Over a week
- Activity status
- Stale
- Clarity
- Needs clarification
- Newbie friendliness
- 25/100