[NEWS] Nowa wersja Developer Apps - analityka Twojej aplikacji / New Developer Apps version - analytics for your application
- 主要语言
- 没有语言数据
- 星标
- 244
- 派生
- 40
- PR 合并指标
- 30 天内没有已合并 PR
描述
Przedstawiamy nową wersję panelu **Developer Apps 2.0**, w której wdrażamy dedykowany moduł analityczny. Naszym celem jest zebranie kluczowych danych o integracji z publicznym API Allegro w jednym miejscu \- tak, aby ułatwić Ci monitorowanie kondycji aplikacji oraz dbanie o zgodność z wymaganiami technicznymi platformy.
Adres URL panelu pozostaje bez zmian: [**apps.developer.allegro.pl**](https://apps.developer.allegro.pl).
Poniżej znajdziesz zestawienie najważniejszych zmian i nowych narzędzi, które ułatwią Ci codzienną pracę oraz debugowanie aplikacji.
**Zgodność z wymogami**

Sekcja ta pozwala szybko zweryfikować, czy Twoje oprogramowanie spełnia wymagania wynikające z naszych wytycznych.
Aktualnie możesz zweryfikować **poprawność nagłówka User-Agent.** [Stosowanie poprawnego nagłówka jest obowiązkowe dla wszystkich aplikacji](https://developer.allegro.pl/news/do-konca-czerwca-2026-zaimplementuj-wlasny-niestandardowy-identyfikator-user-agent-w-twojej-aplikacji-q0K2EbxgXCg). Status *Niezgodny* oznacza, że poprzedniego dnia system odnotował niepoprawny nagłówek lub jego brak w co najmniej jednym zapytaniu do API Allegro.
Jeśli chcesz sprawdzić poprawność konstrukcji swojego nagłówka lub wygenerować nowy, możesz skorzystać [z dedykowanego narzędzia](https://apps.developer.allegro.pl/user-agent).
**Monitorowanie ruchu**

W module **Zapytania do API** znajdziesz wykres przedstawiający dzienną liczbę żądań kierowanych przez Twoją aplikację do publicznego API Allegro. Narzędzie ułatwia śledzenie trendów w wolumenie ruchu oraz proaktywne kontrolowanie limitów.
**Analityka błędów**

W sekcji **Błędy** sprawdzisz, jaki odsetek błędów generują Twoje zapytania. Aby ułatwić Ci diagnozowanie problemów, podzieliliśmy je na dwie kategorie:
* **Błędy techniczne:** agregują klasyczne kody odpowiedzi HTTP (np. 400, 403 itp.), pozwalając szybko namierzyć awarie komunikacyjne lub problemy z autoryzacją.

* **Błędy biznesowe:** wynikają bezpośrednio z logiki procesów operacyjnych na Allegro, takich jak walidacja reguł podczas tworzenia lub edycji ofert.

Dodatkowo **lista błędów biznesowych** pozwala na szczegółowe śledzenie ich występowania. Każda pozycja na liście zawiera dokładny kod błędu, jasny opis dla użytkownika oraz ścieżkę (endpoint), co przyspiesza identyfikację źródła problemu.
**Plany na przyszłość i Twój feedback**
To pierwsza faza rozwoju nowego panelu. Planujemy wdrożyć kolejne metryki, które pomogą Ci monitorować swoją aplikację jeszcze dokładniej.
Chcemy rozwijać to narzędzie w oparciu o Twoje realne potrzeby i feedback. Jeśli masz pomysły na nowe wykresy lub chcesz zgłosić uwagi techniczne, możesz przesłać nam swoją opinię bezpośrednio z poziomu panelu za pomocą przycisku **„Dodaj wykres”**.
--------
We present the new version of the **Developer Apps 2.0** panel, featuring a dedicated analytics module. Our goal is to gather key data about your integration with the Allegro public API in a single location \- making it easier for you to monitor your application's health and ensure compliance with the platform's technical requirements.
The panel URL remains the same: [**apps.developer.allegro.pl**](https://apps.developer.allegro.pl).
Below you will find an overview of the most important changes and new tools designed to facilitate your daily work and application debugging.
**Compliance with requirements**
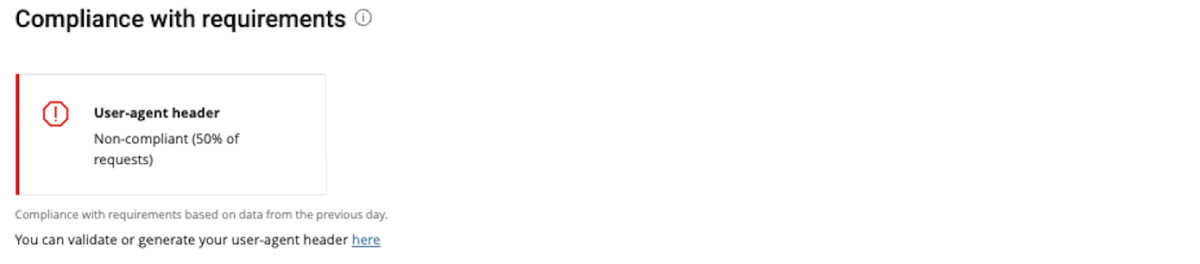
This section allows you to quickly verify whether your software meets the requirements outlined in our guidelines.
Currently, you can verify the **validity of your User-Agent header.** [Using a valid header is mandatory for all applications](https://developer.allegro.pl/news/do-konca-czerwca-2026-zaimplementuj-wlasny-niestandardowy-identyfikator-user-agent-w-twojej-aplikacji-q0K2EbxgXCg). The *Non-compliant* status means that on the previous day, the system recorded an incorrect header or its absence in at least one request to the Allegro API.
If you want to check the structure of your header or generate a new one, you can use [the dedicated tool](https://apps.developer.allegro.pl/user-agent).
**Traffic Monitoring**

In the **API Requests** module, you will find a chart showing the daily number of requests sent by your application to the Allegro public API. This tool makes it easier to track traffic volume trends and proactively manage your limits.
**Error Analytics**

In the **Errors** section, you can check the percentage of errors generated by your requests. To make it easier for you to diagnose issues, we have divided them into two categories:
* **Technical errors:** aggregate classic HTTP response codes (e.g., 400, 403, etc.), allowing you to quickly pinpoint communication failures or authorization issues.

* **Business errors:** result directly from the logic of operational processes on Allegro, such as rule validation when creating or editing offers.

Additionally, the **business errors list** allows for detailed tracking of their occurrences. Each item on the list contains the exact error code, a clear description for the user, and the path (endpoint), which speeds up the identification of the root cause.
**Future Plans and Your Feedback**
This is the first phase of the new panel's development. We plan to introduce additional metrics to help you monitor your application even more thoroughly.
We want to develop this tool based on your real needs and feedback. If you have ideas for new charts or want to report technical comments, you can send us your opinion directly from the panel using the **"Add chart"** button.
贡献指南
这个仓库没有索引到贡献指南
评估
这个 Issue 还没有评估数据。