对象创建太多导致频繁ygc
- Dominant language
- Java
- Stars
- 23.1k
- Forks
- 8.1k
- PR merge metrics
- No merged PRs in 30d
Description
## Issue Description
Type: *bug report*
### Describe what happened (or what feature you want)
本地简单的run一个限流,代码如下:
`
while(true){
Entry entry = null;
try {
entry = SphU.entry("hello", 1);
} catch (BlockException e) {
} finally {
if (entry != null) {
entry.close();
}
}
}`
频繁gc,jprofiler观察mem排名靠前的对象都是sentinel整出来的
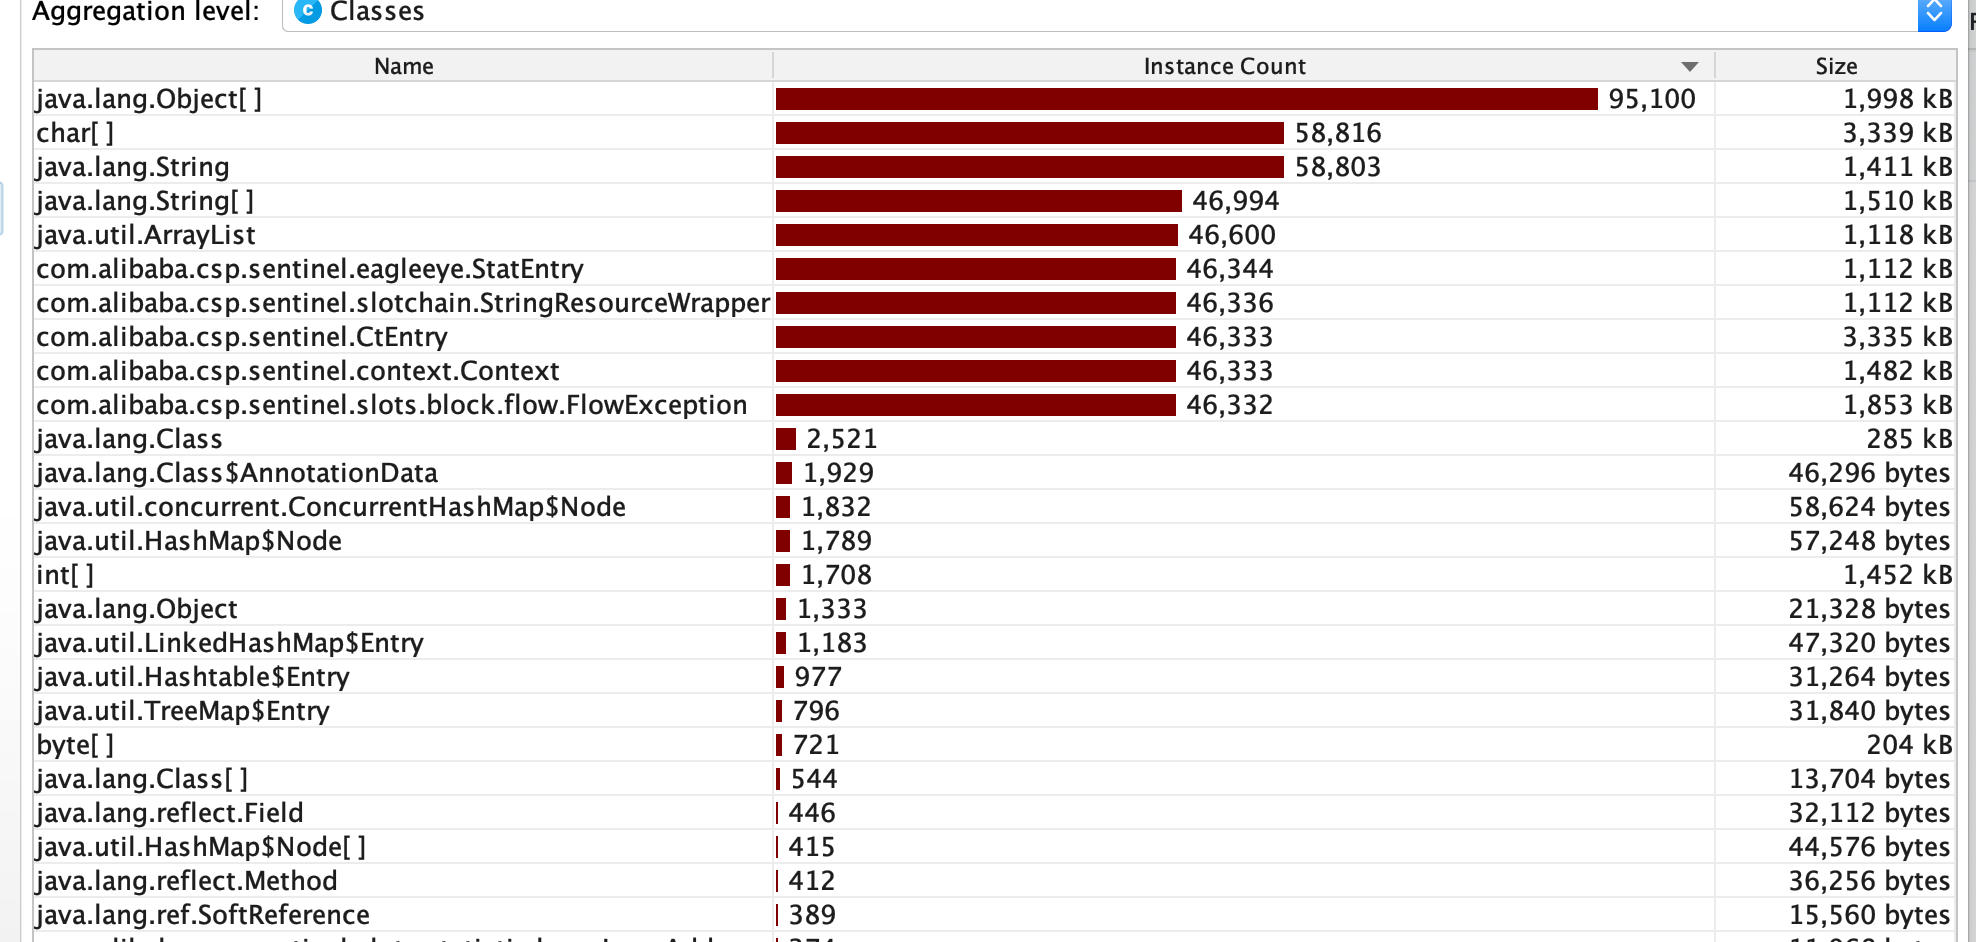
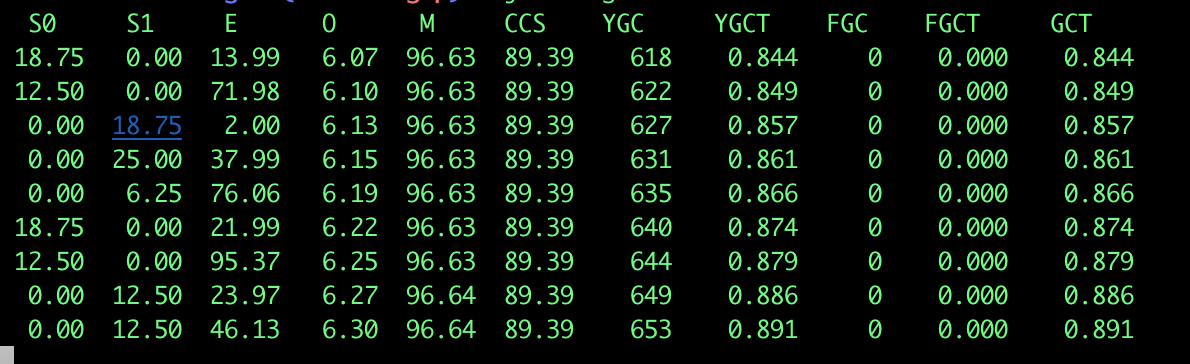
### Describe what you expected to happen
### How to reproduce it (as minimally and precisely as possible)
1.
2.
3.
### Tell us your environment
### Anything else we need to know?
Contributor guide
Research direction
Start with the reported loop around SphU.entry("hello", 1) and reproduce the frequent young-generation garbage collections under profiling. Inspect which Sentinel objects are allocated on each iteration and compare the allocation profile with the entry lifecycle shown in the report. Done should mean identifying and addressing the excessive allocation, with profiling evidence showing reduced GC pressure.
Written by the indexing model from the issue text.
Assessment
- Tech stack
- java
- Domain
- backend, performance
- Issue type
- Bug
- Difficulty
- 4/5
- Estimated time
- 3-5 days
- Activity status
- Stale
- Clarity
- Needs clarification
- Newbie friendliness
- 25/100