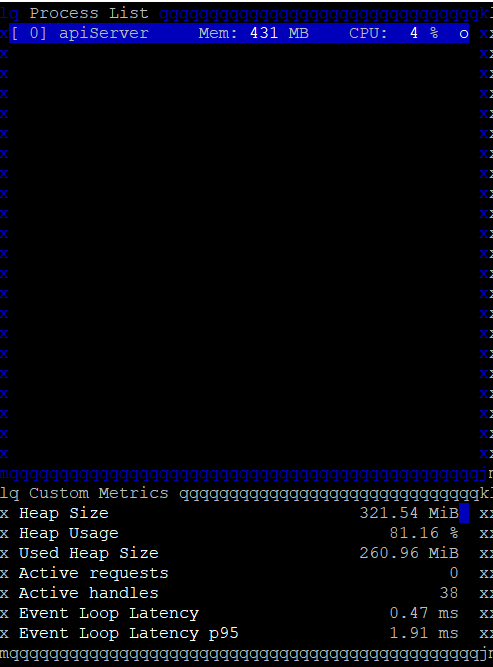
requesting for details on the metrics shown in `pm2 monit`
Nobody has claimed this yet.
- Dominant language
- JavaScript
- Stars
- 43.3k
- Forks
- 2.7k
- PR merge metrics
- No merged PRs in 30d
Description
Why there is a difference in memory usage (431mb vs 321.54mb)?
What does 431mb metric indicate?
What does Active handles mean, what does it indicate?
How can i get these metric details from nodejs programatically?
This post may look redundant.
if you can post answers my questions that will be great else if these questions are already answered please help me out with the materials.
Contributor guide
First steps
- Read the whole issue, then the project's contributing guide.
- Comment on the issue to say you are picking it up — it saves two people doing the same work.
- Fork the repository and make your change on a branch.
- Open a pull request that references the issue number.
Research direction
Use pm2 monit as the entry point and compare the displayed memory values and Active handles metric with the corresponding Node.js programmatic metrics. Done means documenting what each value represents, explaining the discrepancy, and identifying how users can retrieve these metrics from a Node.js program.
Written by the indexing model from the issue text.
Assessment
- Tech stack
- javascript, nodejs
- Domain
- cli, documentation, observability
- Issue type
- Documentation
- Difficulty
- 3/5
- Estimated time
- 1-2 days
- Activity status
- Stale
- Clarity
- Needs clarification
- Newbie friendliness
- 25/100