Color fill error after reprojection
Nobody has claimed this yet.
Assessment
- Difficulty
- 4/5
- Estimated time
- 3-5 days
- Newbie friendliness
- 35/100
- Issue type
- Bug
- Clarity
- Mostly clear
- Activity status
- Stale
- Tech stack
- matplotlib, python
- Domain
- data-visualization
Research direction
Reproduce the issue with the supplied ShapelyFeature examples, comparing PlateCarree and Mollweide projections with filled faces and edges-only rendering. Start by tracing Cartopy's ShapelyFeature and reprojection rendering path; done means the filled geometries display correctly in Mollweide without changing the correct edge rendering.
Written by the indexing model from the issue text.
Description
Hello!
I try to fill them with different colors. If I display the data as it is, in the PlateCarree projection, everything is fine.
import matplotlib.pyplot as plt
import cartopy.crs as ccrs
from cartopy.io.shapereader import Reader
from cartopy.feature import ShapelyFeature

ax = plt.axes(projection=ccrs.PlateCarree())

CM = ShapelyFeature(Reader('CM/10Ma_CM_v7.shp').geometries(),
                        ccrs.PlateCarree(), facecolor='skyblue', edgecolor='silver', linewidths=0.3, zorder=1)
ax.add_feature(CM)

CS = ShapelyFeature(Reader('CS/10Ma_CS_v7.shp').geometries(),
                        ccrs.PlateCarree(), facecolor='tan', edgecolor='black', linewidths=0.3, zorder=2)
ax.add_feature(CS)

ax.set_global()

ax.gridlines(zorder=4, linewidth=0.1, color='gray', alpha=0.5, linestyle='--')

plt.show()
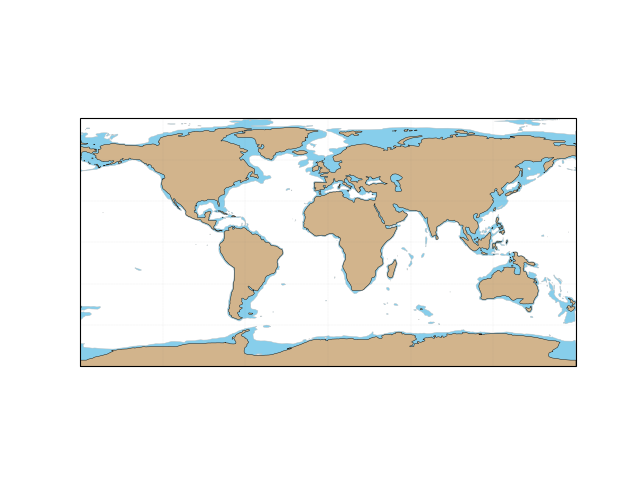
Then I want to use the Mollweide projection.
ax = plt.axes(projection=ccrs.Mollweide())
Shallow water begins to occupy the entire space.
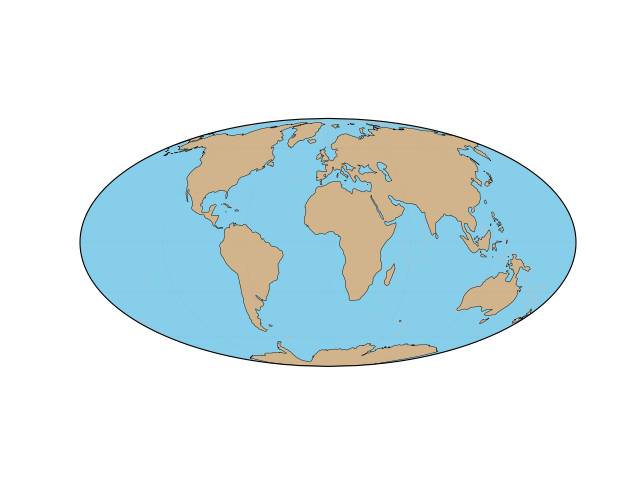
At the same time, if I colored only edges (facecolor='none'), edges is displayed normally.
CM = ShapelyFeature(Reader('CM/10Ma_CM_v7.shp').geometries(),
                        ccrs.PlateCarree(), facecolor='none', edgecolor='blue', linewidths=0.3, zorder=1)
ax.add_feature(CM)

CS = ShapelyFeature(Reader('CS/10Ma_CS_v7.shp').geometries(),
                        ccrs.PlateCarree(), facecolor='none', edgecolor='red', linewidths=0.3, zorder=2)
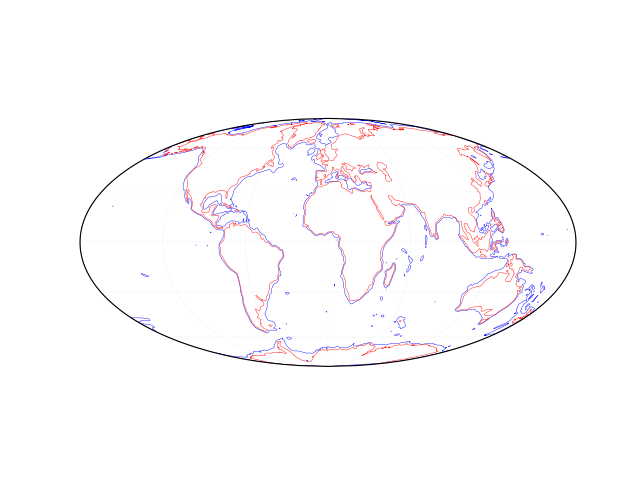
At first I thought it was due to a reprojection error. But then, when I saw that the edges were drawn correctly, I decided that it might be exactly the error of the facecolor parameter.
Windows 10, Python 3.9, Cartopy 0.20 by https://www.lfd.uci.edu/~gohlke/pythonlibs/
- Dominant language
- Python
- Stars
- 1.6k
- Forks
- 399
- Avg merge
- 1d 7h
- Merged PRs (30d)
- 14
Contributor guide
First steps
- Read the whole issue, then the project's contributing guide.
- Comment on the issue to say you are picking it up — it saves two people doing the same work.
- Fork the repository and make your change on a branch.
- Open a pull request that references the issue number.
More from SciTools/cartopy
-
Difficulty 2/5 1-3 hours Newbie friendliness 68/100
-
Difficulty 2/5 1-3 hours Newbie friendliness 72/100
-
No E/W on Dateline OpenComponent: Gridlines
Difficulty 2/5 1-3 hours Newbie friendliness 62/100
-
Difficulty 2/5 1-3 hours Newbie friendliness 68/100
-
Difficulty 4/5 3-5 days Newbie friendliness 55/100
All issues in SciTools/cartopy
Similar issues
-
Difficulty 2/5 1-3 hours Newbie friendliness 74/100
bancolombia/sentinel#23 ·
-
test md OpenCI
Difficulty 2/5 1-3 hours Newbie friendliness 74/100
-
integration:quickjs org:external priority:backlog topic:code-interpreter topic:middleware type:feature
Difficulty 2/5 1-3 hours Newbie friendliness 74/100
langchain-ai/deepagents#6450 ·
-
bug client
Difficulty 2/5 1-3 hours Newbie friendliness 88/100
-
Difficulty 2/5 1-3 hours Newbie friendliness 74/100