PolicyEngine / PolicyEngine/policyengine-us
FR: Generate graphics from unit tests
Open
enhancement
- Dominant language
- Python
- Stars
- 162
- Forks
- 212
- Avg merge
- 3d 3h
- Merged PRs (30d)
- 97
Description
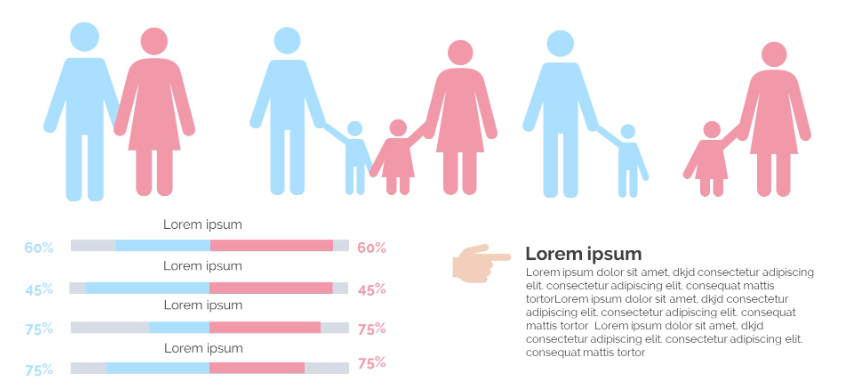
If you think about, each unit tests is a story about a little family.
What if you could create little shareable graphics showing all of the families for a given test/policy?
A little compare and contrast?
Something like:
Contributor guide
Assessment
This issue has not been assessed yet.