NullNet-ai / NullNet-ai/dashguard
Add charts displaying system resources usage
Open
@GyulyVGC is already working on this.
Since Jul 3, 2025.
enhancement
- Dominant language
- TypeScript
- Stars
- 0
- Forks
- 0
- PR merge metrics
- No merged PRs in 30d
Description
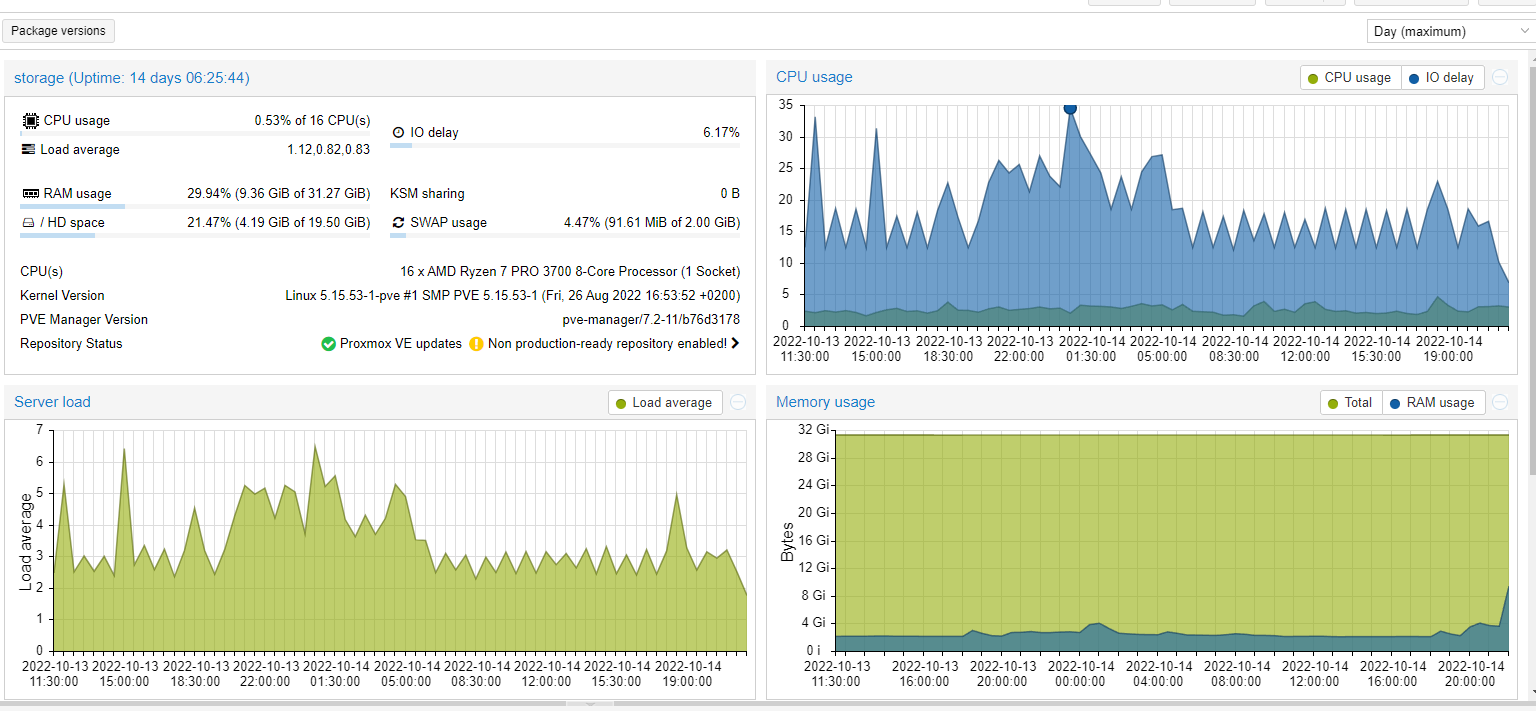
Add charts displaying system resources usage for a given client, or group of clients.
We need line/area charts (as a function of time) for the following resources:
- CPU
- I/O
- Memory
- Disk
- Temperature (optional)
Charts could be implemented using Recharts.
Additionally, we should also have a section reporting the instantaneous values for such resources (related to the most recent time interval available).
We can take inspiration from Proxmox's dashboard (see a sample screenshot below).
Contributor guide
No contributing guide indexed for this repository
First steps
- Read the whole issue, then the project's contributing guide.
- Comment on the issue to say you are picking it up — it saves two people doing the same work.
- Fork the repository and make your change on a branch.
- Open a pull request that references the issue number.
Assessment
This issue has not been assessed yet.