MetaCell / MetaCell/salk-interactive-atlas
Change heat maps to contour plots in 2D visualization
Open
enhancement
- Dominant language
- TypeScript
- Stars
- 2
- Forks
- 1
- PR merge metrics
- No merged PRs in 30d
Description
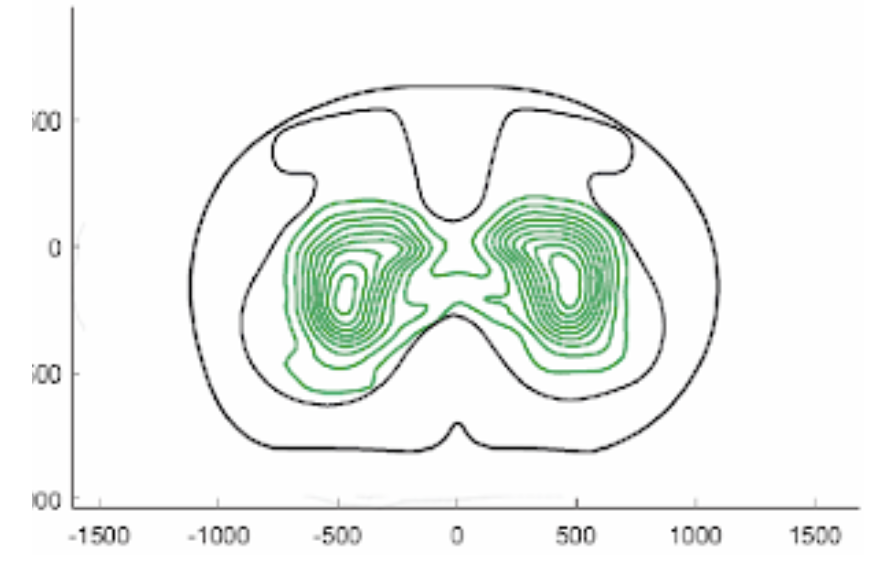
The client want to change the heatmaps into contour plots (see example attached). I am assuming the new contour maps will come from @stephenlenzi and then we will need to change the FE menu
Contributor guide
No contributing guide indexed for this repository
Assessment
This issue has not been assessed yet.