MetaCell / MetaCell/salk-interactive-atlas
Add grid in the 2D visualisation
- Dominant language
- TypeScript
- Stars
- 2
- Forks
- 1
- PR merge metrics
- No merged PRs in 30d
Description
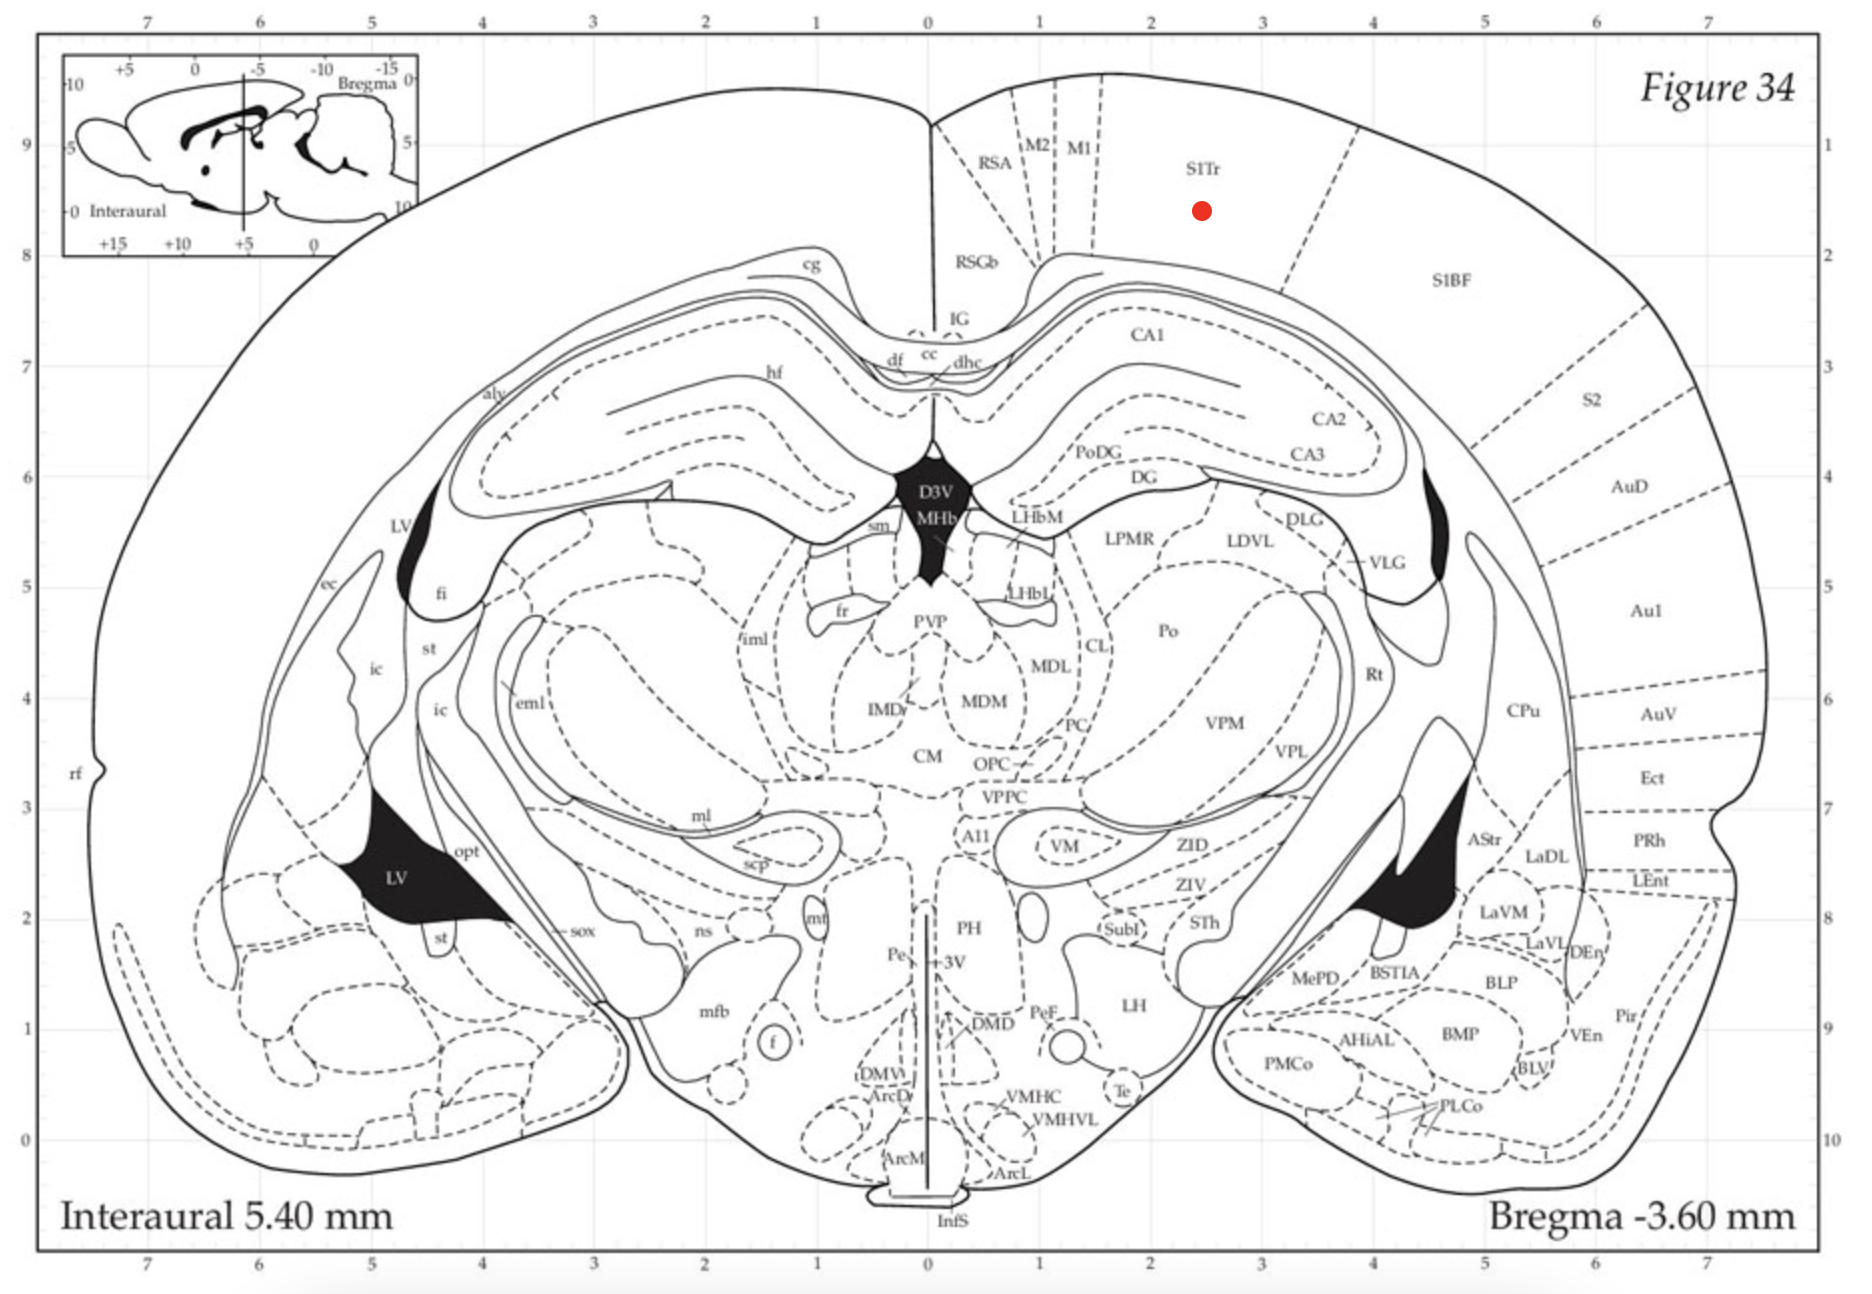
The client asked if we can add in the 2D visualiser a grid around the brain with 1 mm pitch.
The 0 of the x and y axes is the center of the central canal (0,0). The 0 of the z axes is the first slice (so the first slice C1-rostral gets 0, the second slice C1-caudal gets the z value of the first slice of c1 caudal. @afonsobspinto is this something we can do at app level or do we need some more info to be outputted by cordmap? The x value position would be printed in a 'box' on top right corner of the 2d visulizer (we can put it there for now, meanwhile I will ask Paul to update the design)
The expected result is something like this (I am jus talking about the grid)
cc @zsinnema
Contributor guide
No contributing guide indexed for this repository
Assessment
This issue has not been assessed yet.