MaartenGr / MaartenGr/BERTopic
BERTopic: visualize_topics_over_time_area
Nobody has claimed this yet.
- Dominant language
- Python
- Stars
- 7.8k
- Forks
- 920
- Avg merge
- 22h 24m
- Merged PRs (30d)
- 5
Description
For my research work, I was looking for ways to 'present' my topics_over_time more visually appealing.
The hover-on topics trend over time is great.
How about a sort of river-flow or area map plot: a reader can 'quickly the volume' of change over time!
PS: I'm open to a more pythonic way of getting this done.
PS: I'm open to more BERTopic's under-the-hood hooks
NB: To reduce choice overload and still keep with BERTopic philosophy of being **basic**, we can simply implement this with an _arg_ within the existing visualize_topics_over_time.
[My approach]
- in plotting/__init__ | include entry for visualize_topics_over_time_area
```
{extracts}
from ._topics_over_time_area import visualize_topics_over_time_area
- __all__ = [
...,
"visualize_topics_over_time_area"
]
```
- in plotting, add a new file visualize_topics_over_time_area.py | The base is visualize_topics_over_time.py
- NB: the [**visualize_topics_over_time_area.py**](https://github.dev/semmyk-research/BERTopic/blob/5eaaced50b4bd6c722f4933f52e0736bac9292fe/bertopic/plotting/_topics_over_time_area.py) file has comments that I need to clean up.
```
{extracts}
marker_color=colors[index % len(colors)], ##SemmyK: [index % 11], :for topics >7
stackgroup='one' ##SemmyK: Key to area plot
...
hovermode='x unified', ##SemmyK: single hover label. Perhaps, I should use 'x'.
bgcolor="rgba(0,0,0,.05)", #"white", ##SemmyK:adjusted transparency
bordercolor = "rgba(0,0,0,0)" ##SemmyK:remove line border
```
- In my working file, I extend BERTopic to use the extended functionality
```
{extracts}
class BERTopicAreaPlot(BERTopic):
def visualize_topics_over_time_area(self, ... ...
check_is_fitted(self)
return plotting.visualize_topics_over_time_area(self,
```
{extracts}
- To visualise, I called model_ngram_dtm_area.visualize_topics_over_time_area(... ...)
- Sample view
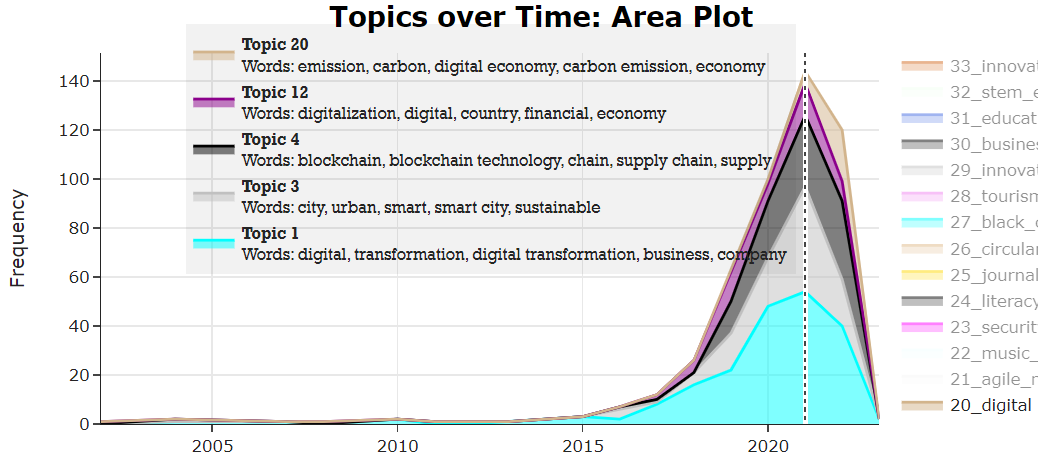
I'm open to a pull request.
Contributor guide
First steps
- Read the whole issue, then the project's contributing guide.
- Comment on the issue to say you are picking it up — it saves two people doing the same work.
- Fork the repository and make your change on a branch.
- Open a pull request that references the issue number.
Research direction
Start by comparing the existing plotting/_topics_over_time.py implementation with the proposed plotting/_topics_over_time_area.py, then inspect plotting/__init__.py for the export pattern. The work is done when the area visualization is integrated through visualize_topics_over_time and BERTopic, with the requested river-flow or area presentation available through the existing API.
Written by the indexing model from the issue text.
Assessment
- Tech stack
- python
- Domain
- data-visualization
- Issue type
- Feature
- Difficulty
- 4/5
- Estimated time
- 3-5 days
- Activity status
- Stale
- Clarity
- Mostly clear
- Newbie friendliness
- 35/100