pgstar Controls
- Dominant language
- Fortran
- Stars
- 249
- Forks
- 82
- Avg merge
- 1d 3h
- Merged PRs (30d)
- 3
Description
I was playing with changing some of the plotting attributes of the echelle diagram (and others) today and a conversation started about adding functionality so users could change things like plot colors and line widths. In specific, the idea of a color-blind friendly palette being used for the default was raised.
I checked some of the default plot colors using Sim Daltonism and it looks like most of the current default colors for plots are fairly color blind friendly, the biggest concern is for monochromacy where most colors are indistinguishable. The following color scheme from [Paul Tol's Notes](https://personal.sron.nl/~pault/) works even for monochromacy.
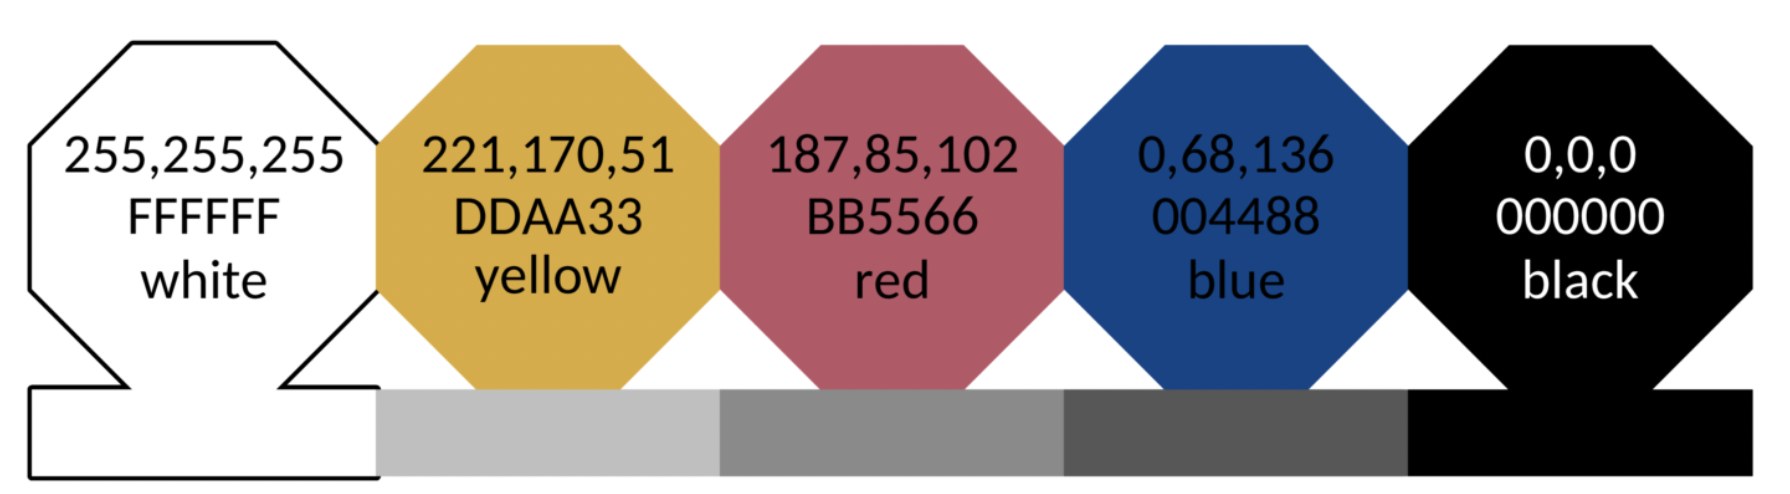
I spent some time this afternoon hunting around the MESA source code to see if there was any way to build some functionality for users to change colors and other plot attributes, but it looks like that is more complicated than expected. Figured I would post here if anyone had any thoughts or existing run_star_extras subroutines to add this feature.
P.S. I know not everyone uses pgstar and chooses to just plot in a separate program post run, but I thought this could provide some nice usability for those who still plot with pgstar.
Contributor guide
Research direction
Start by reviewing the pgstar plotting configuration and the run_star_extras subroutines mentioned in the issue to understand how plot attributes are currently selected. The work is complete when users can change plot colors and line widths and the default palette is color-blind friendly, including for monochromacy.
Written by the indexing model from the issue text.
Assessment
- Tech stack
- fortran
- Domain
- data-visualization
- Issue type
- Feature
- Difficulty
- 5/5
- Estimated time
- Over a week
- Activity status
- Stale
- Clarity
- Needs clarification
- Newbie friendliness
- 25/100