Auto re-adjust max/min axis limits when enabling/disabling series from the Legend
- Dominant language
- Python
- Stars
- 2.8k
- Forks
- 419
- PR merge metrics
- No merged PRs in 30d
Description
For example, I have a XY plot with many series drawn simultaneously. One serie is far to the right of the X axis. When I disable it by clicking on the legend, I would like the X axis maximum to re-adjust, so that the rest of the details are visible.
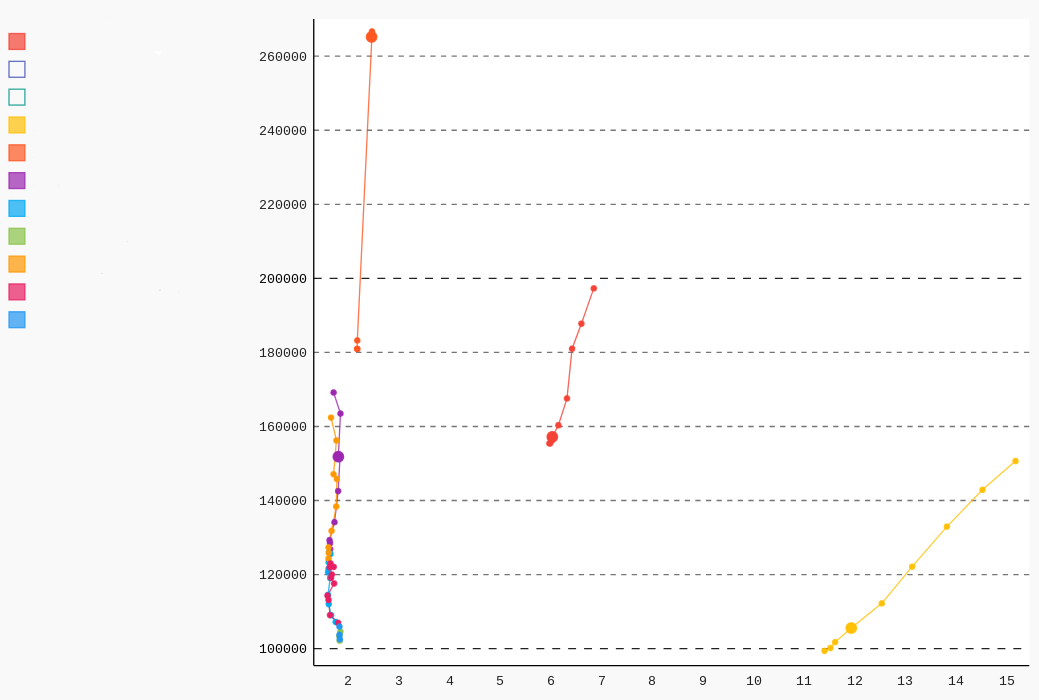
Would a contribution be accepted, or is this out of scope for pygal? I believe this involves mostly a simple javascript change, but am not sure if it's desirable, seeing that the js file has not changed since 2015.
Contributor guide
Research direction
No file or test is named in the issue. Start by locating the JavaScript legend-toggle behavior and the existing axis-limit calculation; done means disabling a series re-adjusts the relevant maximum or minimum so remaining details are visible, and re-enabling it restores the needed range.
Written by the indexing model from the issue text.
Assessment
- Tech stack
- javascript, python
- Domain
- data-visualization
- Issue type
- Feature
- Difficulty
- 4/5
- Estimated time
- 3-5 days
- Activity status
- Stale
- Clarity
- Mostly clear
- Newbie friendliness
- 35/100