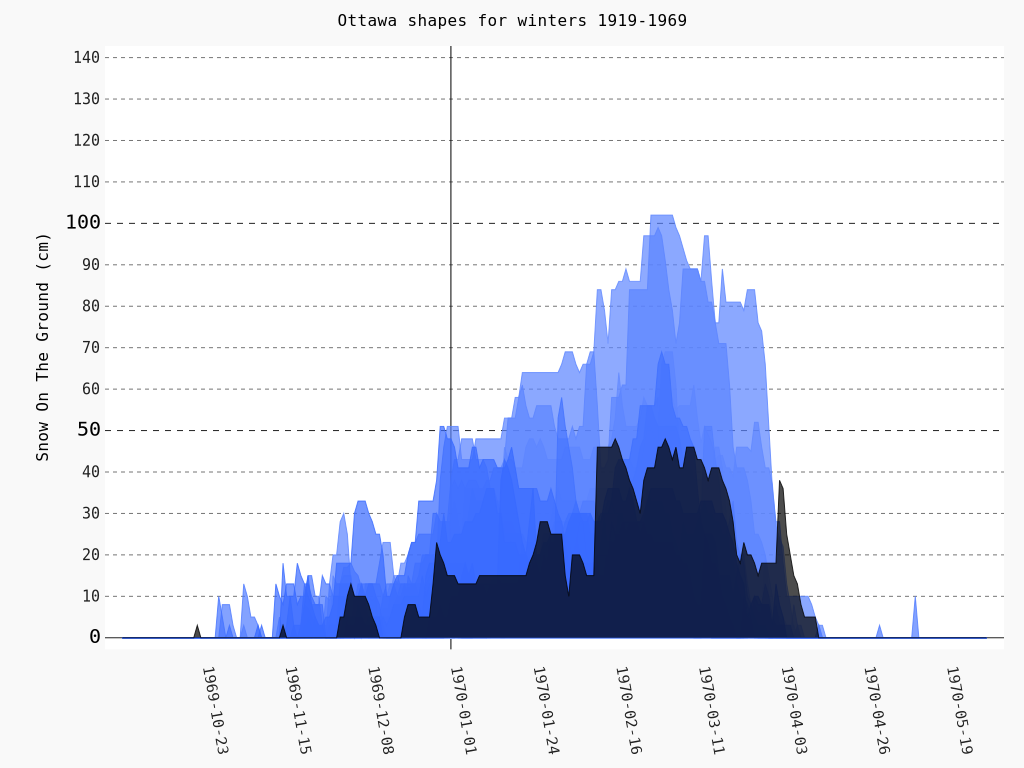
DateLine that spans 1970 places y-axis on 1970-01-01
- Dominant language
- Python
- Stars
- 2.8k
- Forks
- 419
- PR merge metrics
- No merged PRs in 30d
Description
When using "DateLine", and when some of the dates are before 1970-01-01, and others after 1970-01-01, the y-axis is placed on 1970-01-01.
For other years, the y-axis remains at the left of the chart.
I'm sure I can guess why it's like that (you probably map it to an interval value which crosses "0". But that detail should be hidden from the user. The y-axis should always be at the left edge on a DateLine plot (unless someone specifies its location).
Contributor guide
Research direction
Start by reproducing the DateLine case with dates on both sides of 1970-01-01 and inspect how the chart chooses the y-axis position. Trace the date-to-axis handling, add a regression test for dates spanning 1970, and verify that the axis stays at the left edge unless explicitly positioned.
Written by the indexing model from the issue text.
Assessment
- Tech stack
- python
- Domain
- data-visualization
- Issue type
- Bug
- Difficulty
- 3/5
- Estimated time
- 1-2 days
- Activity status
- Stale
- Clarity
- Mostly clear
- Newbie friendliness
- 48/100