add Pie plot to ggdsl-echarts
Open
echarts
- Dominant language
- Kotlin
- Stars
- 744
- Forks
- 27
- Avg merge
- 4d 1h
- Merged PRs (30d)
- 1
Description
## Pie chart
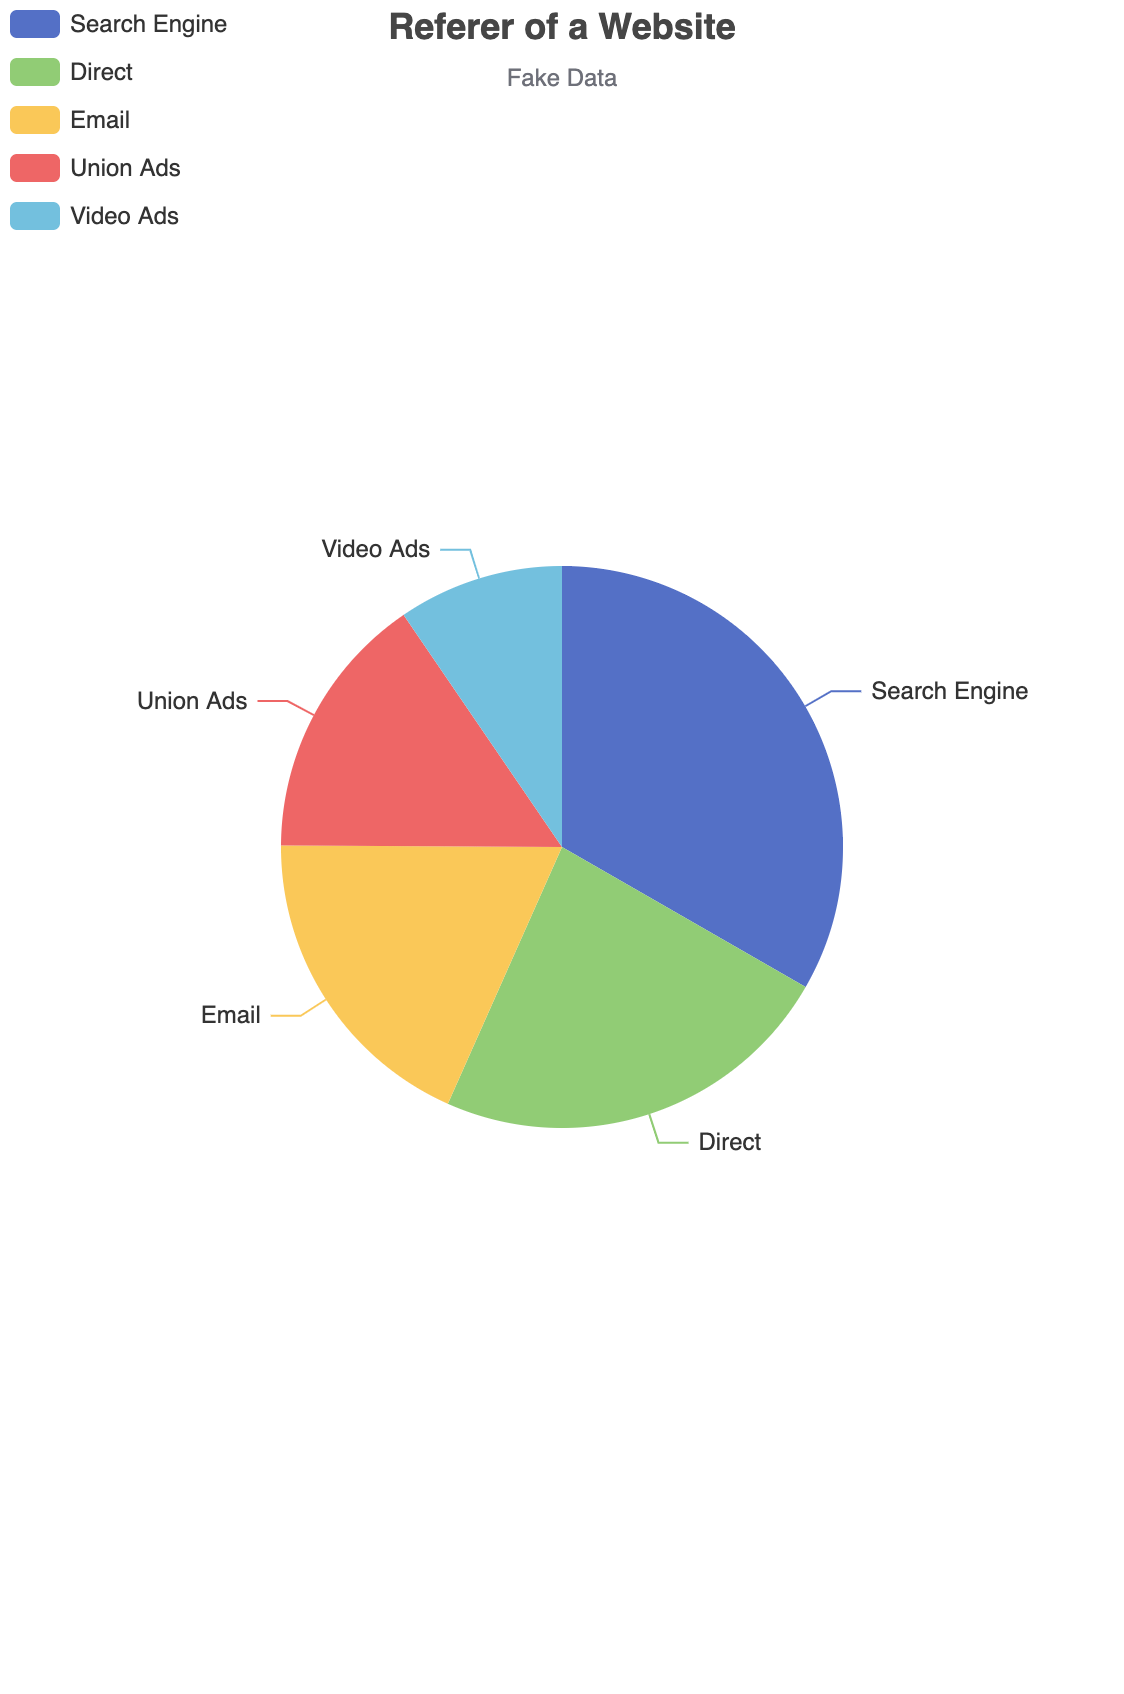
parameters and settings:
* `colorBy` / `groupBy`
* `borderType`
* `borderCap`
* `borderJoin`
* default others
Contributor guide
Research direction
The issue requests a Pie chart in ggdsl-echarts and lists colorBy/groupBy, borderType, borderCap, and borderJoin as parameters, with other settings using defaults. Locate the existing plot implementations and their tests, then verify that the new chart supports the listed parameters and renders the requested pie plot.
Written by the indexing model from the issue text.
Assessment
- Tech stack
- kotlin
- Domain
- data-visualization
- Issue type
- Feature
- Difficulty
- 4/5
- Estimated time
- 3-5 days
- Activity status
- Stale
- Clarity
- Mostly clear
- Newbie friendliness
- 35/100