JuliaSIMD / JuliaSIMD/LoopVectorization.jl
Any way I can reduce time-to-first-loop-vectorization?
- Dominant language
- Julia
- Stars
- 789
- Forks
- 73
- PR merge metrics
- No merged PRs in 30d
Description
This is a fantastic package. I've discovered that it, like Julia in general, comes with a hidden cost, "time to first plot." My [package](https://github.com/droodman/WildBootTests.jl) currently uses @tturbo in half a dozen utility functions, such as for computing columnwise dot products of two wide matrices. @tturbo speeds these up. But it adds greatly to latency, to the point where that I worry that it will repel users. The package is a statistical tool. If we want Julia to be used interactively like R for statistics, or even for fast Julia-based packages to be used via connectors in R and Python, I think people will not want to have to wait 30 seconds for each tool they load in each session.
I'm just wondering if there's anything _I_ can do now to minimize the tradeoff in using LoopVectorization.
I have applied SnoopCompile and striven to follow the advice of @timholy in its documentation. Here is the summarized output from a SnoopCompile result called `tinf` when I don't use LoopVectorization, and call my package for the first time in a session:
```
julia> tinf
InferenceTimingNode: 14.882703/16.869373 on Core.Compiler.Timings.ROOT() with 139 direct children
```
And here it is when I do use @tturbo in the package:
```
julia> tinf
InferenceTimingNode: 18.754393/28.590440 on Core.Compiler.Timings.ROOT() with 261 direct children
```
If I understand right, without @tturbo, there's ~2 seconds of inference on first use and ~15 seconds (14.882703) of other stuff (for the displayed total of 16.869373). Using @tturbo adds ~8 seconds of inference and ~4 seconds of other stuff. The SnoopCompile flame graph of the latter is:
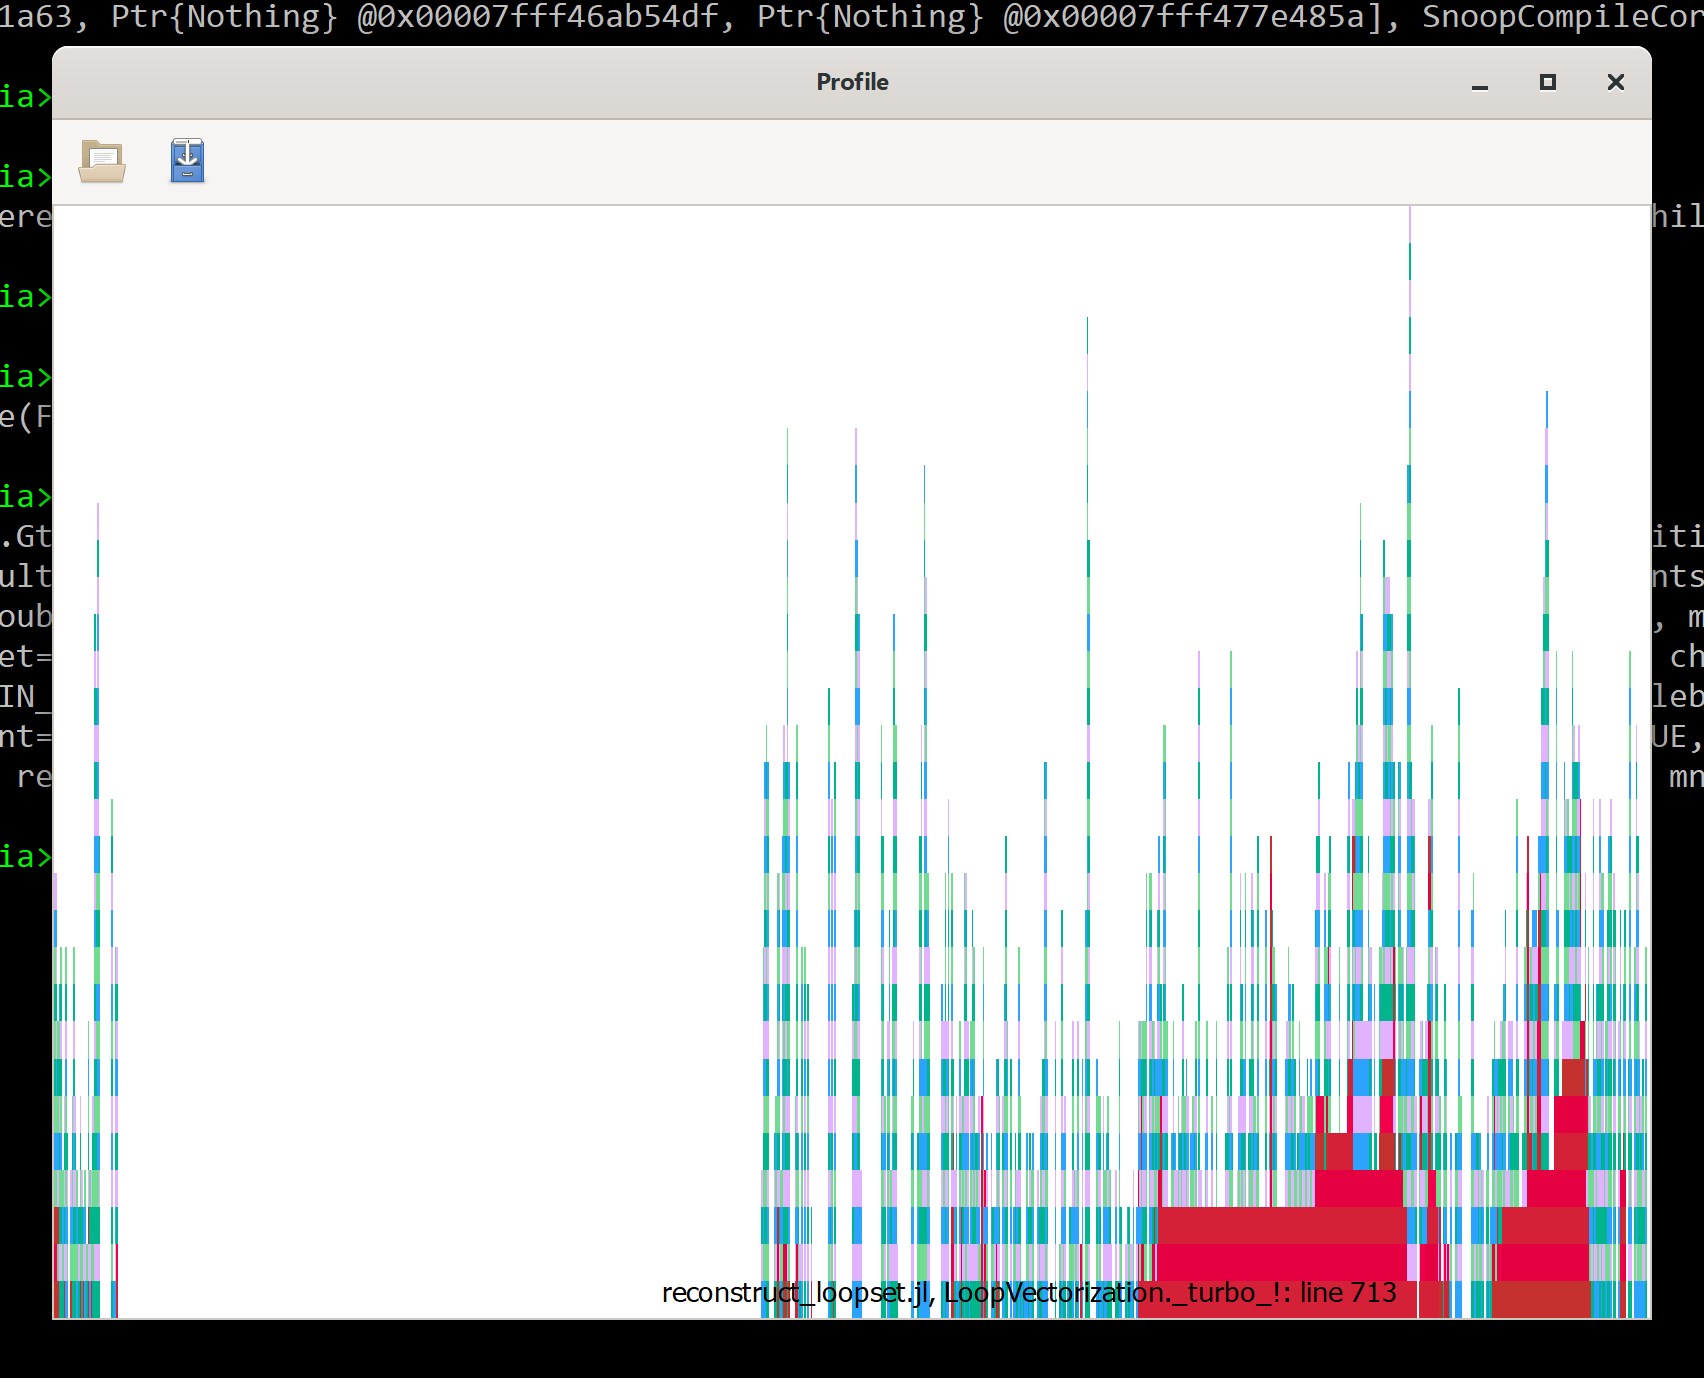
In case useful, here is a clean demo of what I'm experiencing, @tturbo creating a lot of latency despite the use of precompile():
```
using Pkg
Pkg.generate("TurboDemo")
Pkg.activate("TurboDemo")
Pkg.add("LoopVectorization")
Pkg.resolve()
Pkg.activate()
open("TurboDemo/src/TurboDemo.jl", "w") do io
write(io, """
module TurboDemo
using LoopVectorization
function coldot!(dest::Matrix{Float64}, A::Matrix{Float64}, B::Matrix{Float64})
@tturbo for i ∈ eachindex(axes(A,2),axes(B,2)), j ∈ eachindex(axes(A,1),axes(B,1))
dest[i] += A[j,i] * B[j,i]
end
nothing
end
precompile(coldot!, (Matrix{Float64}, Matrix{Float64}, Matrix{Float64}))
end
""")
end
push!(LOAD_PATH, "TurboDemo/")
using TurboDemo, SnoopCompileCore
A = rand(10,10000); B = rand(10,10000); dest = fill(0.,1,10000);
tinf = @snoopi_deep TurboDemo.coldot!(dest,A,B);
using SnoopCompile, ProfileView, Profile
tinf
```
I get:
```
InferenceTimingNode: 0.198680/9.662668 on Core.Compiler.Timings.ROOT() with 8 direct children
```
which I gather means close to 10 seconds of load-time inference.
Thanks!
Contributor guide
No contributing guide indexed for this repository
Assessment
This issue has not been assessed yet.