JuliaPlots / JuliaPlots/PlotlyJS.jl
PNG output broken for parallel coordinates plot
- Dominant language
- Julia
- Stars
- 444
- Forks
- 86
- PR merge metrics
- No merged PRs in 30d
Description
**Describe the bug**
If I create a parallel coordinates plot for largish data DataFrame with 20342 rows, 17 columns and some 25 groups in the following way:
```julia
mytrace = parcoords(;line = attr(color=filtered.species_numbered, colorscale="Portland"),
dimensions = [
attr(range = [minimum(filtered.start),maximum(filtered.start)],
label = "start", values = filtered.start),
attr(range = [minimum(filtered.stop),maximum(filtered.stop)],
label = "stop", values = filtered.stop),
attr(range = [minimum(filtered.start_mod),maximum(filtered.start_mod)],
label = "start_mod", values = filtered.start_mod),
attr(range = [minimum(filtered.stop_mod),maximum(filtered.stop_mod)],
label = "stop_mod", values = filtered.stop_mod)
]);
myplot = plot(mytrace)
```
with `start`, `stop`, `start_mod`, `stop_mod` being some of the 17 dimensions of the data, coloured by the mentioned groups, and try to save the resulting plot via
```julia
savefig(myplot, "test.png", format = "png")
```
many of the lines that are present in the plot as displayed by Jupyterlab or in JUNO are missing in the png file. If I use the camera symbol, no lines are visible at all.
Plot as displayed:
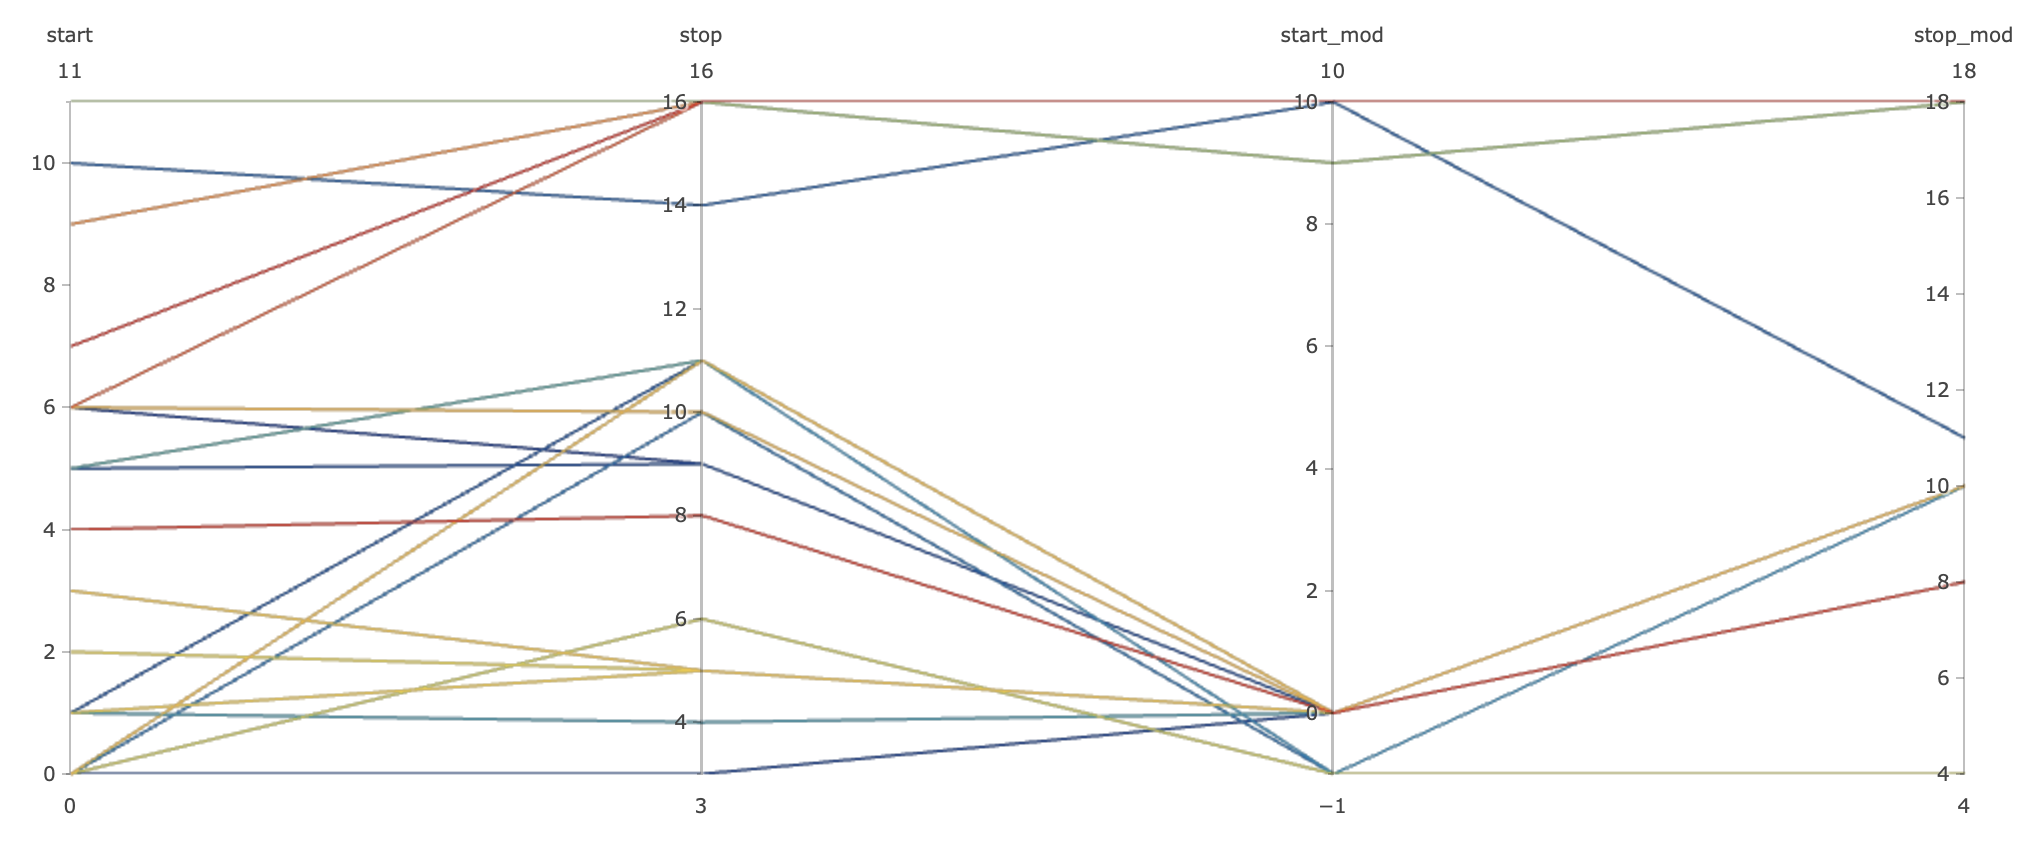
Plot as saved to png:

Plot as saved via camera symbol:

Moreover, this seems to be the case for all output formats except for html, where everything works normal. Yet again, using the camera symbol in a html file thus produced results in missing lines.
**Version info**
0. System: macOS Catalina, using homebrew as package manager
1. output of julia command `versioninfo()`:
```bash
Julia Version 1.4.0
Commit b8e9a9ecc6 (2020-03-21 16:36 UTC)
Platform Info:
OS: macOS (x86_64-apple-darwin18.6.0)
CPU: Intel(R) Core(TM) i5-8500 CPU @ 3.00GHz
WORD_SIZE: 64
LIBM: libopenlibm
LLVM: libLLVM-8.0.1 (ORCJIT, skylake)
```
2. Output running the following in Julia 0.7 or greater: `using Pkg; pkg"status"` (if you are on Julia 0.6 or earlier run `Pkg.status()`):
```bash
julia> using Pkg
julia> pkg"status"
Status `~/.julia/environments/v1.4/Project.toml`
[5d742f6a] CSVFiles v1.0.0
[aaaa29a8] Clustering v0.13.5
[5721bf48] DataVoyager v1.0.0
[d872a56f] ElectronDisplay v1.0.0
[28b8d3ca] GR v0.48.0
[f67ccb44] HDF5 v0.13.1
[7073ff75] IJulia v1.20.0
[ee78f7c6] Makie v0.9.6
[6f286f6a] MultivariateStats v0.7.0
[47be7bcc] ORCA v0.3.1
[eadc2687] Pandas v1.4.0
[f0f68f2c] PlotlyJS v0.13.1
[91a5bcdd] Plots v1.0.5
[438e738f] PyCall v1.91.4
[d330b81b] PyPlot v2.9.0
[1a8c2f83] Query v0.12.2
[2913bbd2] StatsBase v0.32.2
[65254759] StatsMakie v0.1.5
[f3b207a7] StatsPlots v0.14.4
[112f6efa] VegaLite v2.1.3
[0f1e0344] WebIO v0.8.11
[9a3f8284] Random
julia>
```
This happens in exactly the same way on another system which uses macports instead of homebrew.
This bug renders PlotlyJS basically useless for me, because I heavily rely on features like parallel-coordinates-plots for high-dimensional data visualization for exploration of my data.
Contributor guide
No contributing guide indexed for this repository
Assessment
This issue has not been assessed yet.