JetBrains / JetBrains/lets-plot
geom_bar: aes 'fill' and trans 'log10' break y scale
Open
- Dominant language
- Kotlin
- Stars
- 1.8k
- Forks
- 60
- PR merge metrics
- No merged PRs in 30d
Description
Example:
```python
n = 1000
np.random.seed(42)
data = {
"x": np.random.choice(["a", "b", "c"], p=[.49, .49, .02], size=n),
"g": np.random.choice(["X", "Y"], size=n),
}
ggplot(data, aes(x="x", fill="g")) + geom_bar() + scale_y_continuous(trans='log10')
```
Output:
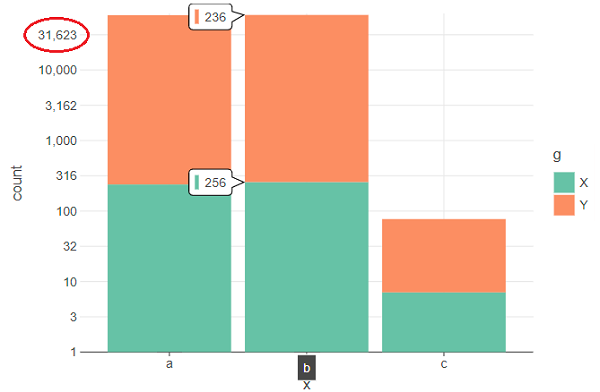
Label values on `y` axis are much greater than expected. There is no such trouble if `fill="g"` or `trans='log10'` will be removed.
Contributor guide
No contributing guide indexed for this repository
Assessment
This issue has not been assessed yet.