Graylog2 / Graylog2/graylog2-server
Add Process Tree Visualizations to Dashboards
Open
feature
triaged
- Dominant language
- Java
- Stars
- 8.1k
- Forks
- 1.1k
- Avg merge
- 1d 20h
- Merged PRs (30d)
- 217
Description
## What?
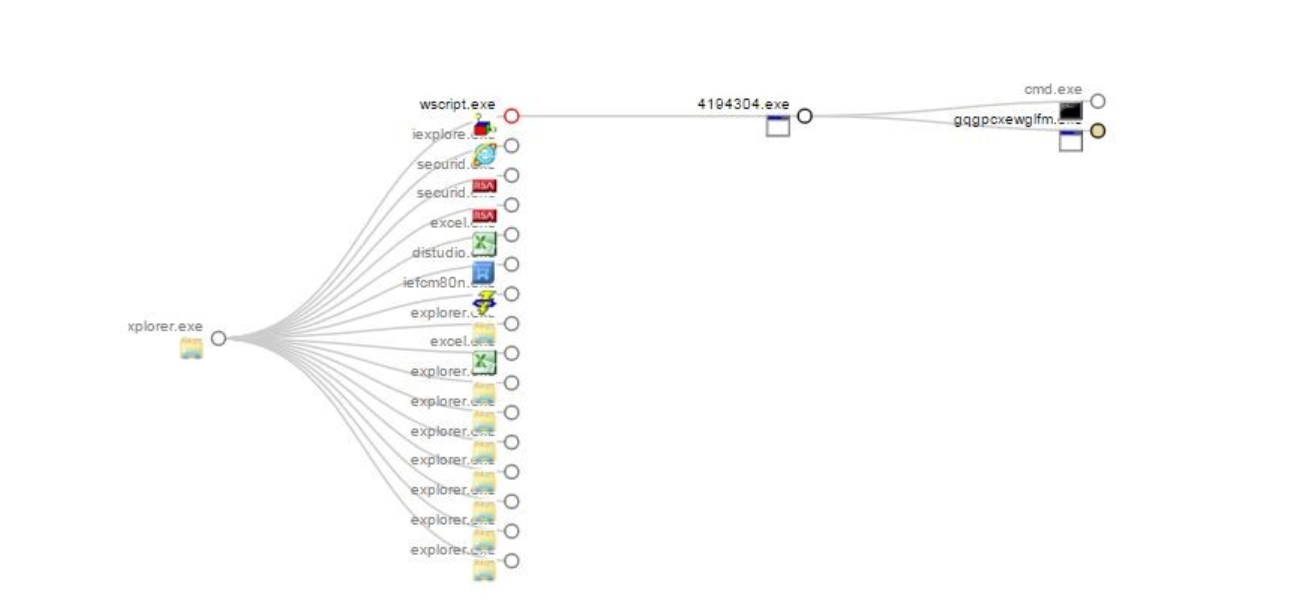
A process tree visualization would allow for visualizing of sequential or otherwise connected events, showing the relationship between them as a graph. Example is attached.
## Why?
Customer uses sysmon data to collect process create and process access events. In Graylog I can create aggregations but visualizing this data in a graph format like a tree is very helpful. It makes the flow of events easier to follow.
## Your Environment
* Graylog Version:
* Elasticsearch Version:
* MongoDB Version:
* Operating System:
* Browser version:
Contributor guide
Assessment
This issue has not been assessed yet.