Graylog2 / Graylog2/graylog2-server
Dashboards: same values in rows displayed once
- Dominant language
- Java
- Stars
- 8.1k
- Forks
- 1.1k
- Avg merge
- 1d 20h
- Merged PRs (30d)
- 217
Description
## Expected Behavior
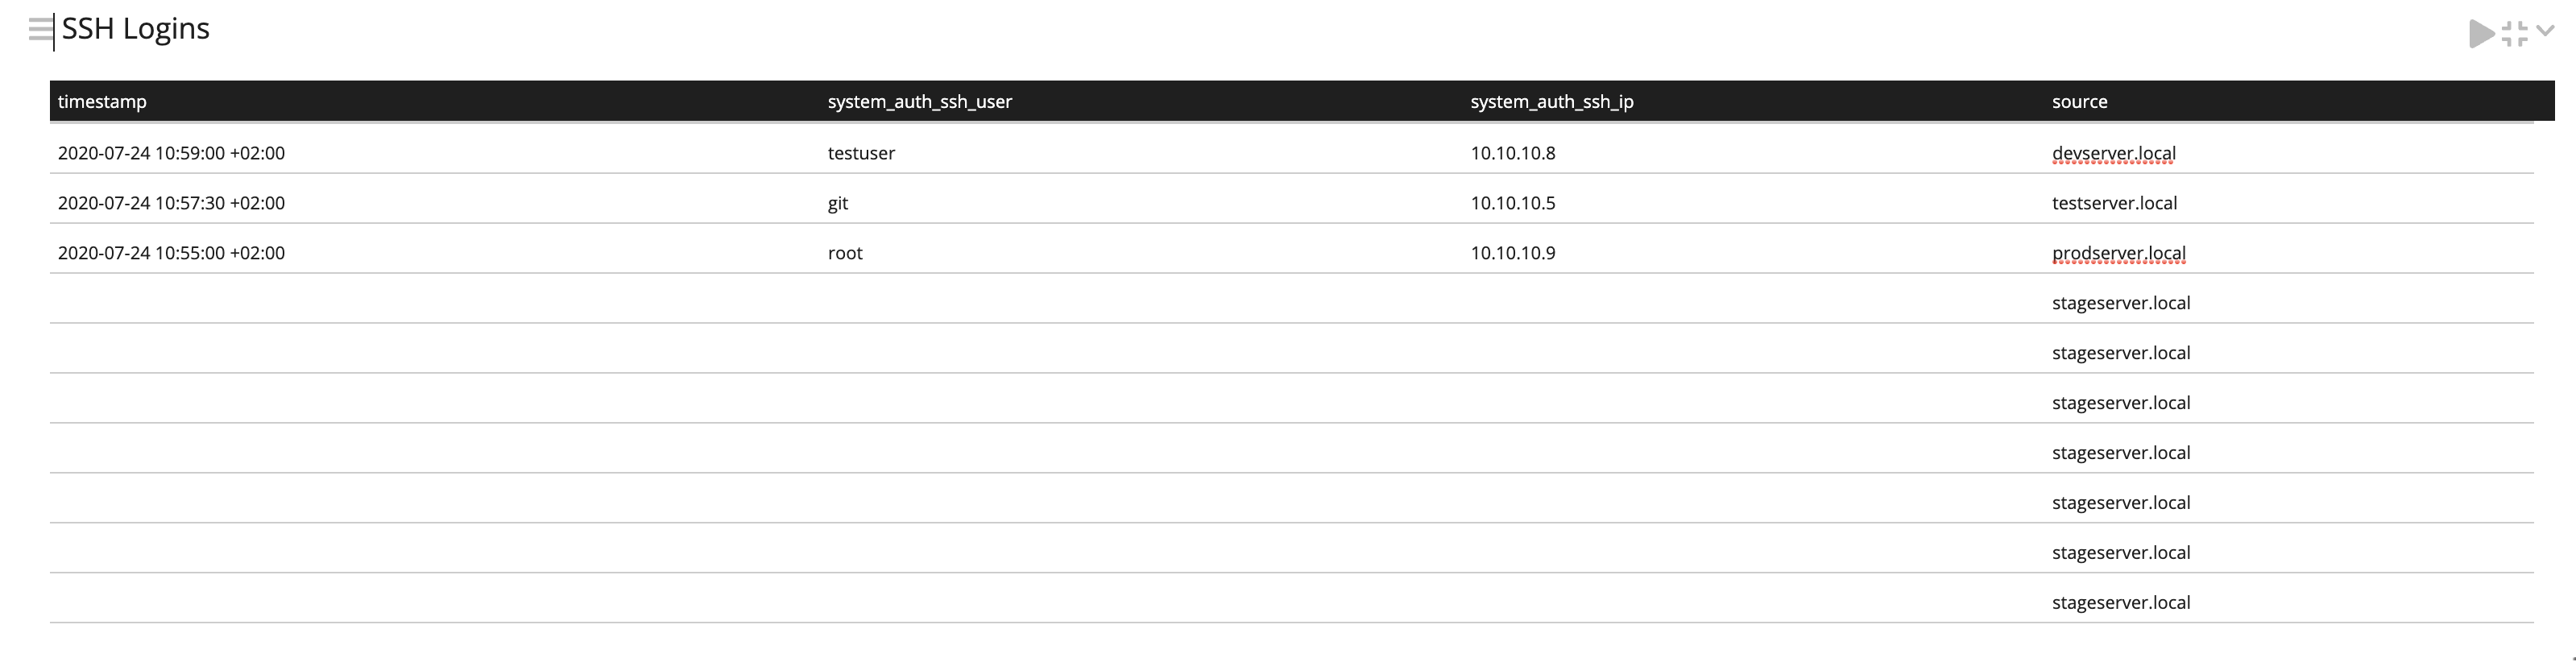
I expect that in every row with same values the will be repeated and showed correctly.
I wish there would be a switch/option to change that behaviour to show each values in a own row.
## Current Behavior
The current behaviour is that fields in rows are empty when it's exists once.
See the following screenshot for details:
## Possible Solution
## Steps to Reproduce (for bugs)
1. Create Grok Pattern with name SSHAUTH and pattern
```
%{SYSLOGTIMESTAMP:system.auth.timestamp} %{SYSLOGHOST:system.auth.hostname} %{PROG:system.auth.program}(?:\[%{POSINT:pid}\]): %{DATA} %{DATA} %{DATA} %{DATA:system.auth.ssh.user} %{DATA} %{DATA:system.auth.ssh.ip} %{DATA} %{DATA} %{DATA}:(?:%{GREEDYDATA:system.auth.ssh.signature})
```
2. Create Pipeline with the following rule in stage 0 and connect it to your stream where auth.log is logged
```
rule "sshauth"
when
true
then
let authlog_test = grok("%{SSHAUTH}", to_string($message.message), true);
set_fields(authlog_test);
end
```
3. Create Dashboard with Data Table and add for example system.auth.ssh.user, system.auth.ssh.ip and source as rows to it.
4. Your Dashboard should look now like in the screenshot above.
## Context
I want to have a Dashboard for SSH Logins where I can see the logins from the last 5 minutes from specific servers.
## Your Environment
* Graylog Version: 3.3.2-1
* Elasticsearch Version: 6.8.10
* MongoDB Version: 4.2.8
* Server Operating System: Debian 10.4
* Client Operating System: MacOS 10.15.6
* Browser version: 78.0.2
Contributor guide
Assessment
This issue has not been assessed yet.