Graylog2 / Graylog2/graylog2-server
Allow drawing metrics on second y-axis in graphs
Open
feature
search
triaged
- Dominant language
- Java
- Stars
- 8.1k
- Forks
- 1.1k
- Avg merge
- 1d 20h
- Merged PRs (30d)
- 217
Description
## What?
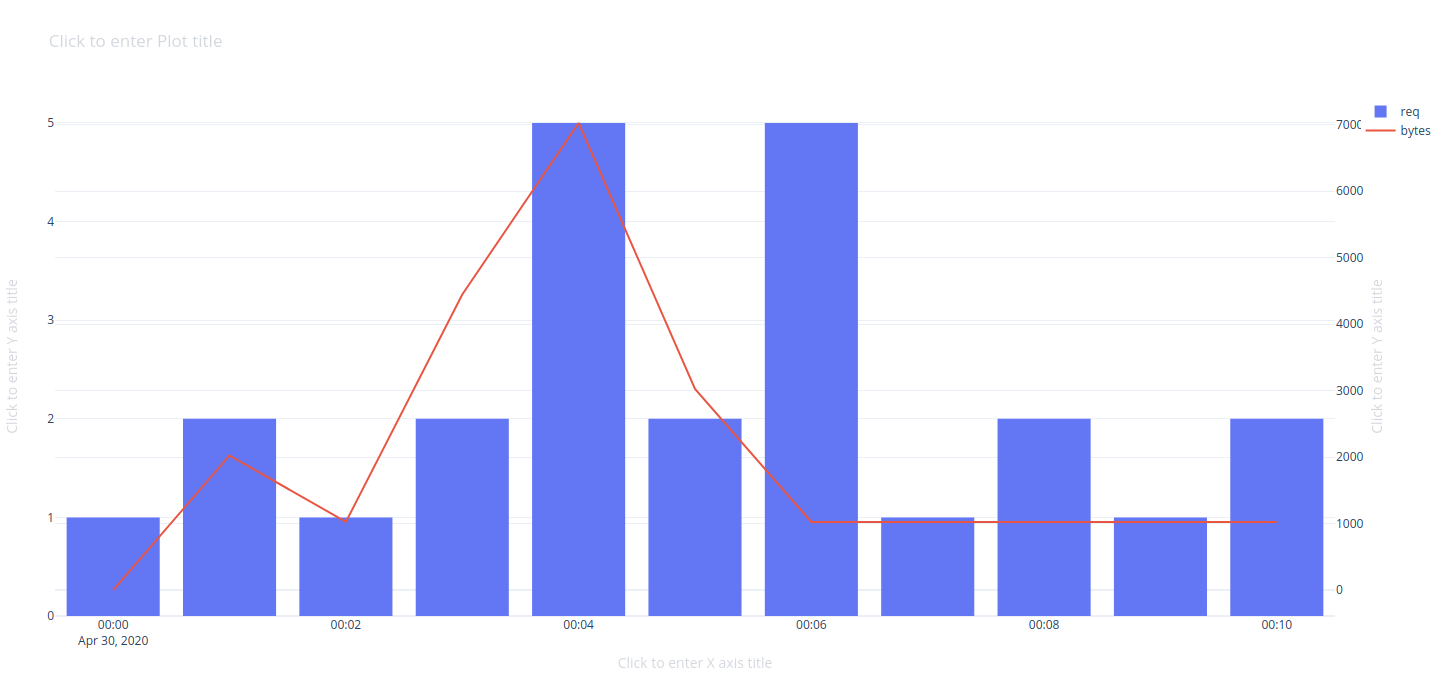
Make it possible to configure a second y-axis in graphs:
## Why?
Drawing two metrics on the same y-axis can be problematic if one metric has very high values and the second quite low values. One example would be graphing number of requests and bytes on the same graph.
## Your Environment
* Graylog Version: 3.3.0-beta.2
Contributor guide
Assessment
This issue has not been assessed yet.