Graylog2 / Graylog2/graylog2-server
Displaying many event annotations inside a chart, results in a slow application
Open
improvement
search
- Dominant language
- Java
- Stars
- 8.1k
- Forks
- 1.1k
- Avg merge
- 1d 20h
- Merged PRs (30d)
- 217
Description
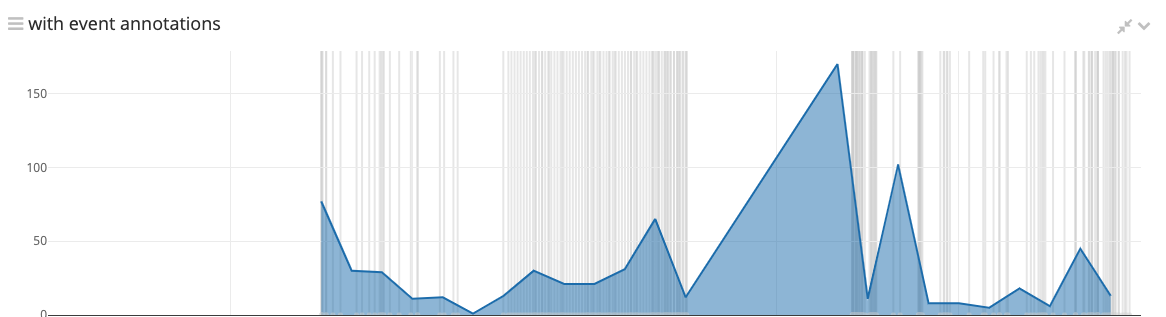
This is maybe an edge case, but I realised there is no limit for the amount of event annotations, displayed inside a chart widget. This can result in a slow application.
Example of a chart with many event annotations:
## Possible Solution
At least in my case, summarizing the event annotations or setting a visible limit, would help with the performance problem.
## Your Environment
* Graylog Version: 3.2.0-beta.4-SNAPSHOT
Contributor guide
Assessment
This issue has not been assessed yet.