Graylog2 / Graylog2/graylog2-server
Tooltip when mousing over a particular colour in a visualisation should only convey the legend relating to that colour.
- Dominant language
- Java
- Stars
- 8.1k
- Forks
- 1.1k
- Avg merge
- 1d 20h
- Merged PRs (30d)
- 217
Description
When creating a visualisation in Graylog, you can often have a large number of different keys in the legend. For example, 15 different colours relating to 15 different IP addresses.
## Expected Behavior
When you mouse over a particular colour in the visualisation, you expect to see the tooltip label relating only to that colour.
Eg. "Hey, what is that huge spike of brown at 03:00? I will mouse over the column to check which IP that is because I can't make out the colour. Ah yes, it's IP 192.168.0.16".
Clicking on it should then give the option to filter by that value.
## Current Behavior
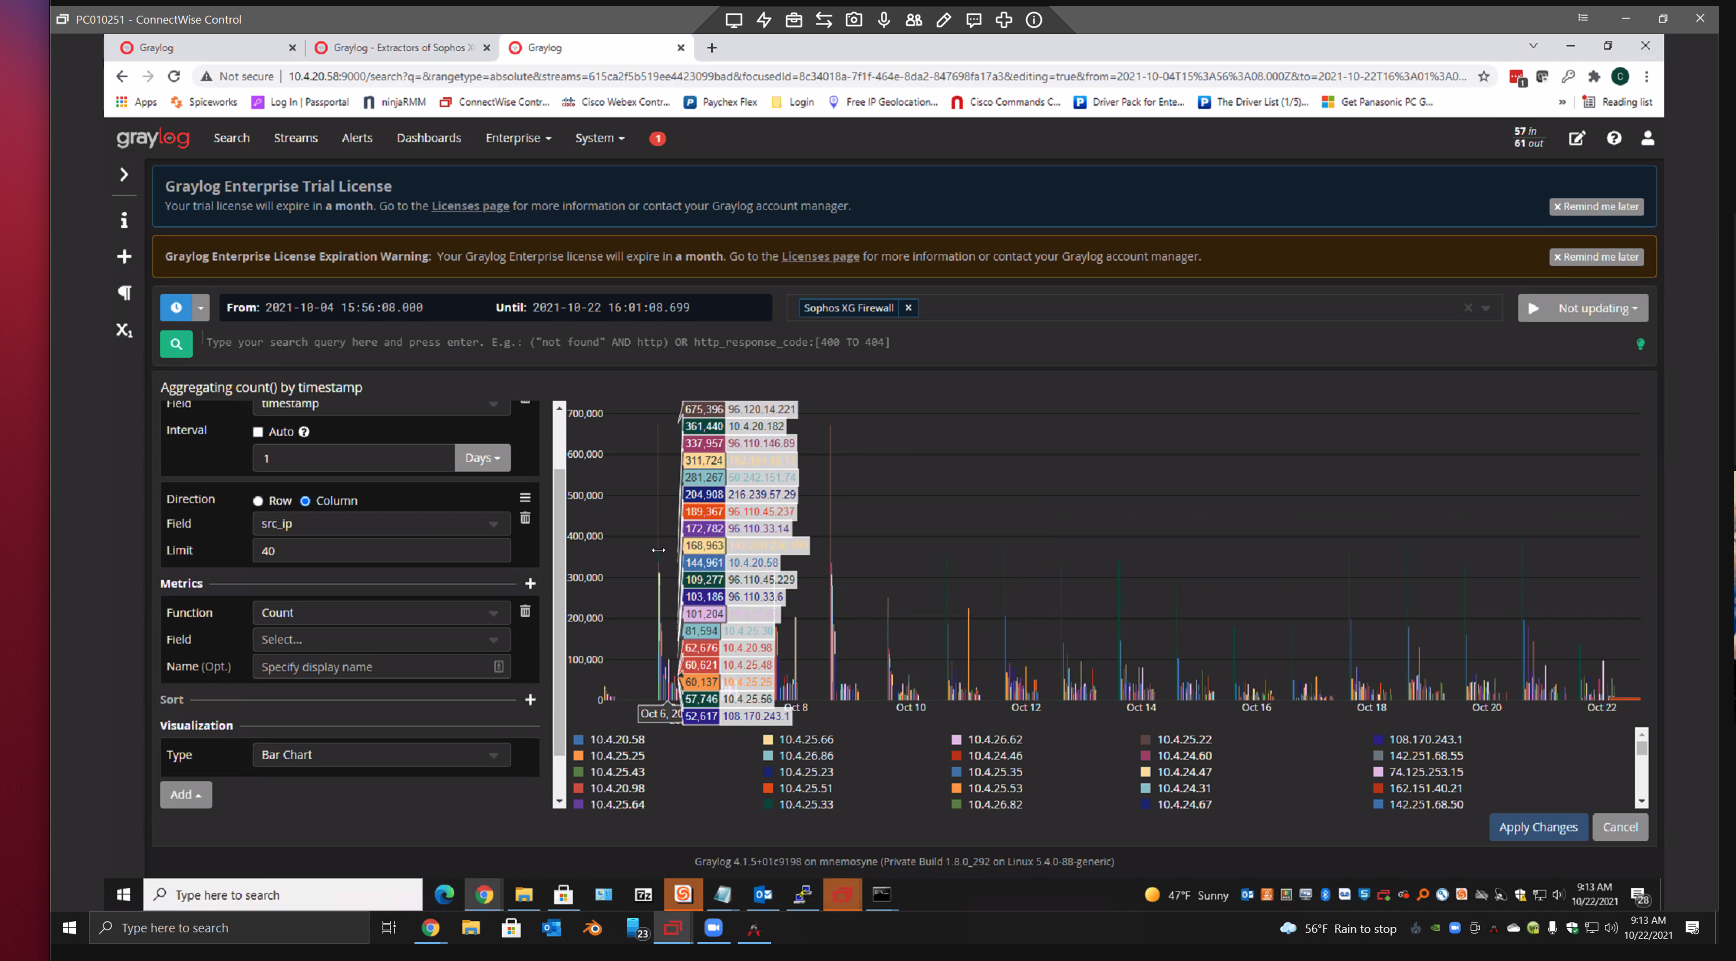
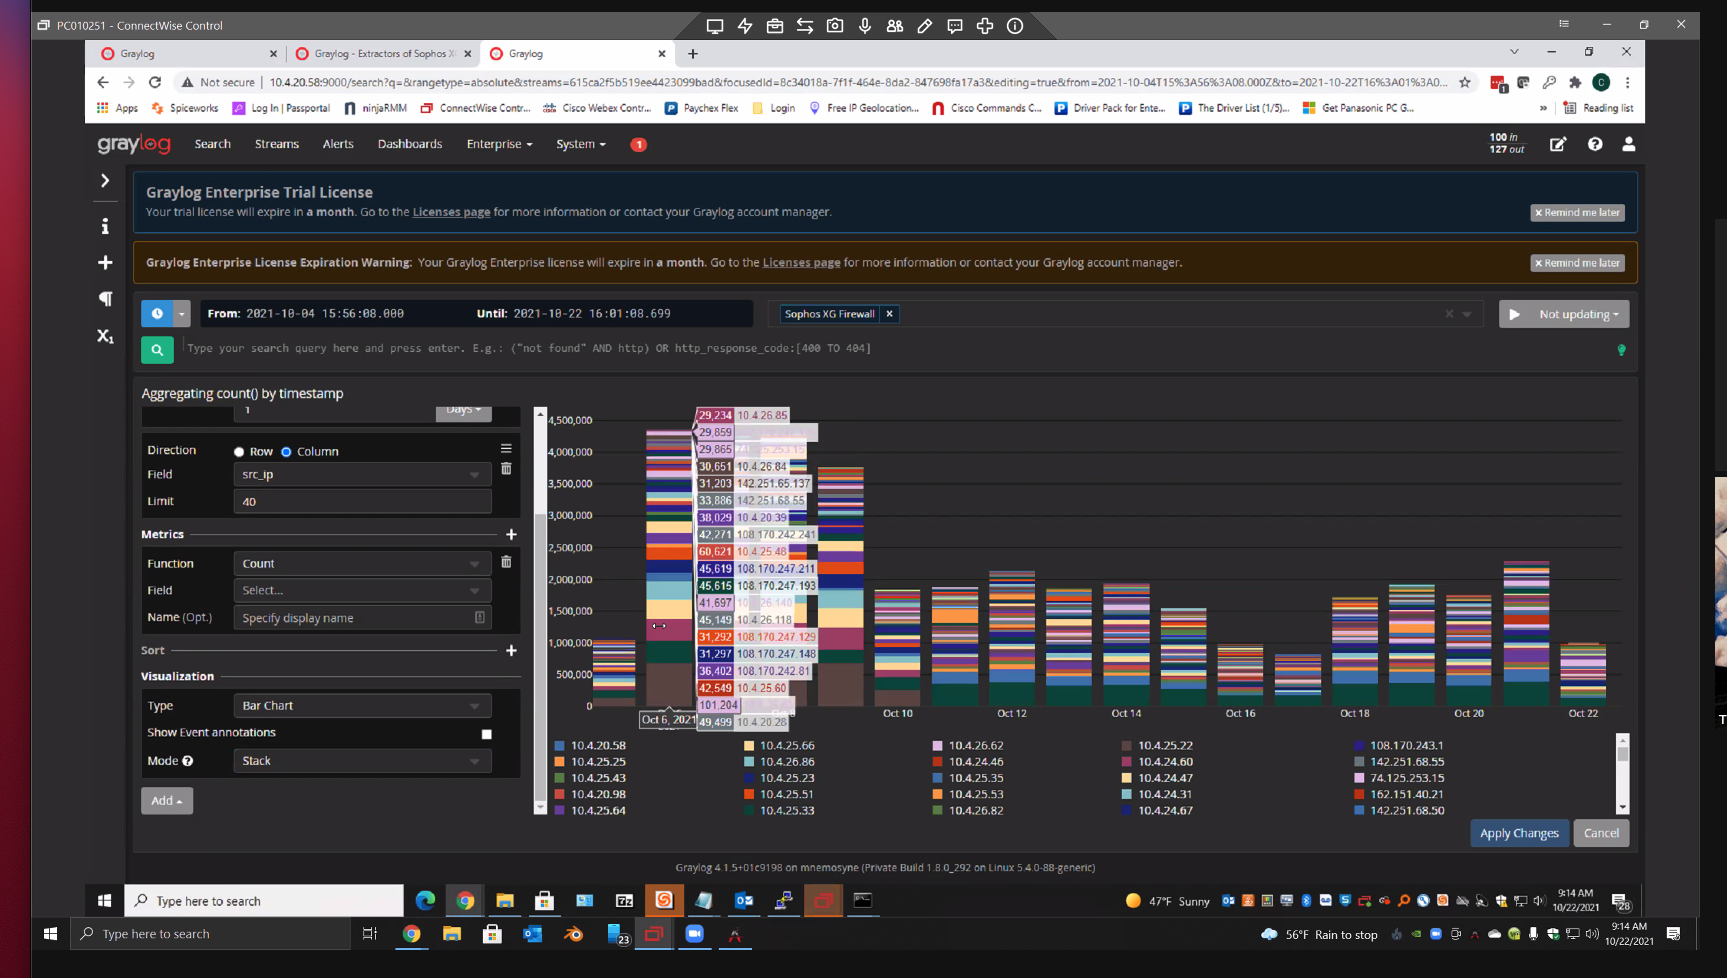
When you mouse over a particular colour in the visualisation, Graylog unhelpfully reiterates the entire legend into the tooltip label. This does not help you figure out which item from the legend you are mousing over.
Eg. "Hey, what is that huge spike of brown at 03:00? I will mouse over the column to check which IP that is because I can't make out the colour. Cool, so it's either IP 192.168.0.16, 192.168.0.7, 192.168.0.11, 192.168.0.20, 192.168.0.111, 192.168.0.3, 192.168.0.167 192.168.0.1688 192.168.0.37, 192.168.0.255, 192.168.0.244, or 192.168.0.1, that really helped me".
To illustrate this, two irritating images:
## Your Environment
Graylog 4.16
Contributor guide
Assessment
This issue has not been assessed yet.