Graylog2 / Graylog2/graylog2-server
Stream wise traffic statistics display per day ingestion.
- Dominant language
- Java
- Stars
- 8.1k
- Forks
- 1.1k
- Avg merge
- 1d 20h
- Merged PRs (30d)
- 217
Description
Need Stream wise per day traffic statistics. Like One stream is having how much of data ingestion per day
## What?
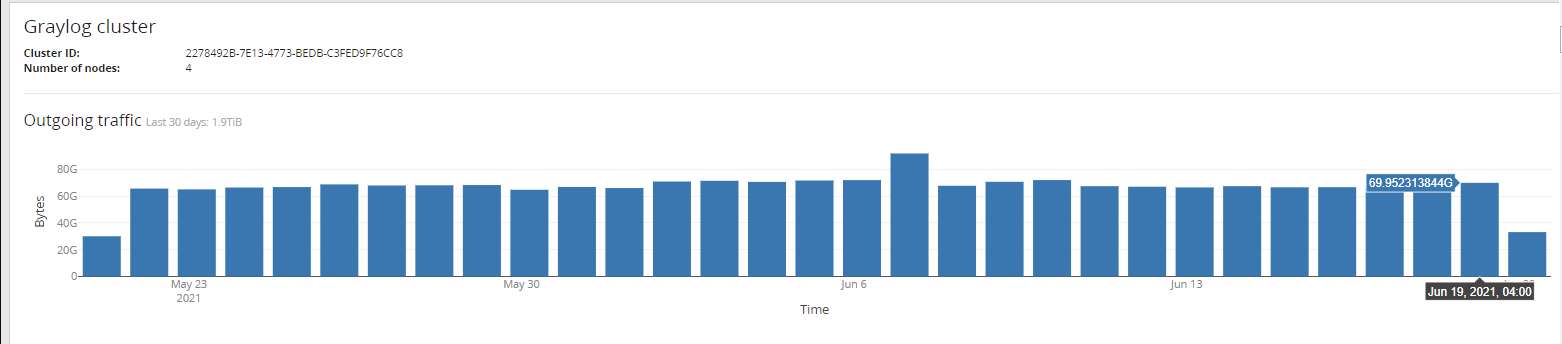
Currently, we have two views to see traffic statistics per day: One is overall traffic per day, and another is individual source wise per day. Both the views are not giving total traffic per day per stream. We need some graph or dashboard which can give this data. Or, when we click on the below graph for any day, it will show a split of total traffic consumption per stream. Or it should display in per stream's more option as daily traffic ingested data.
## Why?
This is required to analyze license utilization is distributed across all the streams uniformly or not. There may be a chance some streams have huge data per day, which is actually not required or useless in Graylog. So we need to identify such top license consuming streams and take action accordingly.
It should display Stream's -> More Option --> Daily Traffic - Display how much data ingested daily on that particular stream.

HS-447850758
## Your Environment
* Graylog Version: 3.3.4
* Elasticsearch Version: 6.8
* MongoDB Version: 4.0.10
* Operating System: RHEL7.7
* Browser version: Chrome: Version 91.0.4472.106 64 bit
Contributor guide
Assessment
This issue has not been assessed yet.