GoogleCloudPlatform / GoogleCloudPlatform/k8s-stackdriver
[prometheus-to-sd] Histogram Quantiles not showing up in metrics explorer in SD
- Dominant language
- Go
- Stars
- 409
- Forks
- 236
- Avg merge
- 2h 34m
- Merged PRs (30d)
- 9
Description
In my application, I have created a histogram to track a downstream rest service call. On my Kube cluster, when I do port forwarding and check the actuator/prometheus metrics, I can see them being logged:
```
# HELP application_restTemplateService_time_seconds
# TYPE application_restTemplateService_time_seconds summary
application_restTemplateService_time_seconds{quantile="0.5",} 0.065011712
application_restTemplateService_time_seconds{quantile="0.95",} 0.098566144
application_restTemplateService_time_seconds{quantile="0.99",} 0.350224384
application_restTemplateService_time_seconds{quantile="0.999",} 1.809842176
application_restTemplateService_time_seconds_count 15848.0
application_restTemplateService_time_seconds_sum 1353.125
# HELP application_restTemplateService_time_seconds_max
# TYPE application_restTemplateService_time_seconds_max gauge
application_restTemplateService_time_seconds_max 3.005
```
However, when I go to the Metrics Explorer in Monitoring for StackDriver, I can only see the count/sum/max metrics.
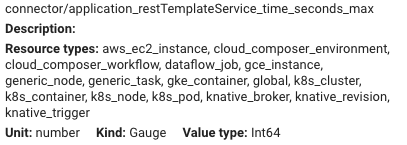
Is there anything special I need to do to have the Histogram show up in SD? Per the documentation, it can parse anything matching the prometheus exposition format: https://prometheus.io/docs/instrumenting/exposition_formats/ which my metric matches:
`rpc_duration_seconds{quantile="0.01"} 3102`
Contributor guide
Assessment
This issue has not been assessed yet.