GoogleChrome / GoogleChrome/lighthouse
Pagespeed.web.dev becomes unresponsive when switching to Desktop tab
- Dominant language
- JavaScript
- Stars
- 30.8k
- Forks
- 9.8k
- Avg merge
- 1d 14h
- Merged PRs (30d)
- 20
Description
edit: 🔒 b/259930042
----------
### FAQ
- [X] Yes, my issue is not about [variability](https://github.com/GoogleChrome/lighthouse/blob/master/docs/variability.md) or [throttling](https://github.com/GoogleChrome/lighthouse/blob/master/docs/throttling.md).
- [X] Yes, my issue is not about a specific accessibility audit (file with [axe-core](https://github.com/dequelabs/axe-core) instead).
### URL
https://www.tokopedia.com/discovery/waktu-indonesia-belanja
### What happened?
Steps to Reproduce
1. Opened https://pagespeed.web.dev/report?url=https%3A%2F%2Fwww.tokopedia.com%2Fdiscovery%2Fwaktu-indonesia-belanja
2. Clicked on Mobile Tab and viewed the full report by scrolling to the bottom
3. Then click on the Desktop tab
4. The report showed only the Crux report, and below it, all is coming as blank
4. After some time, the page becomes unresponsive, with certain sections blank in the report.
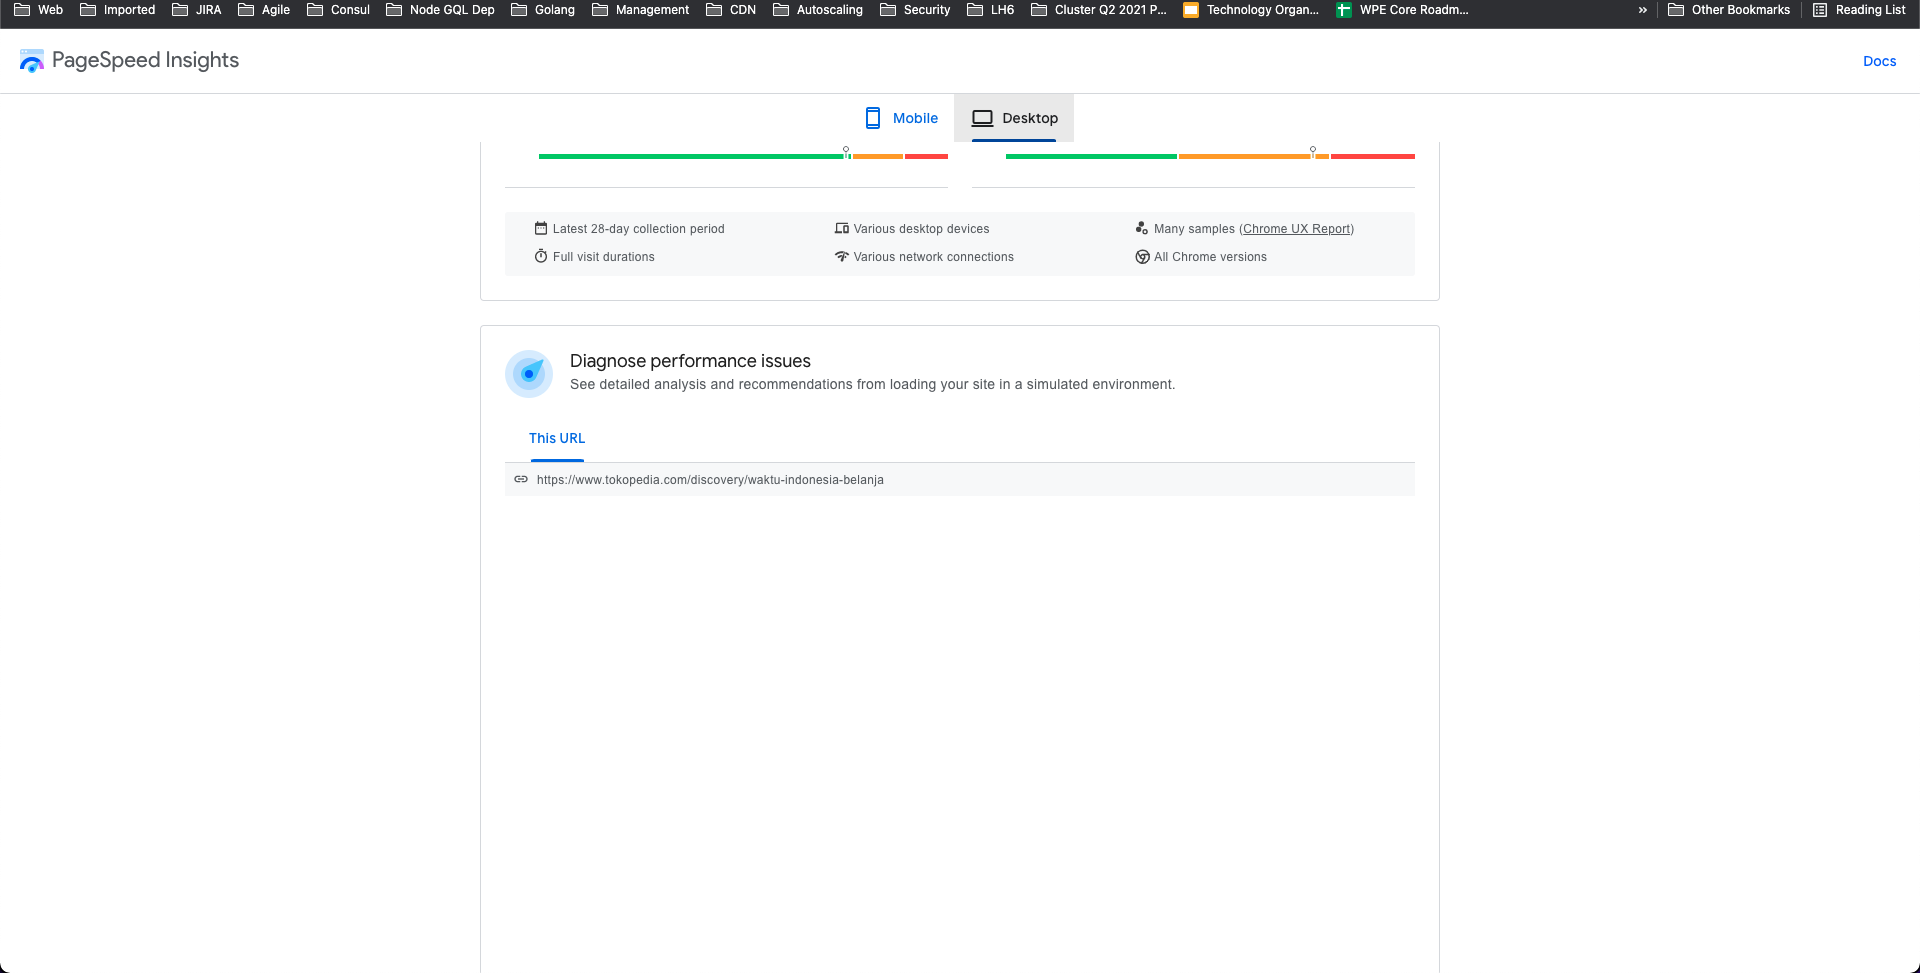
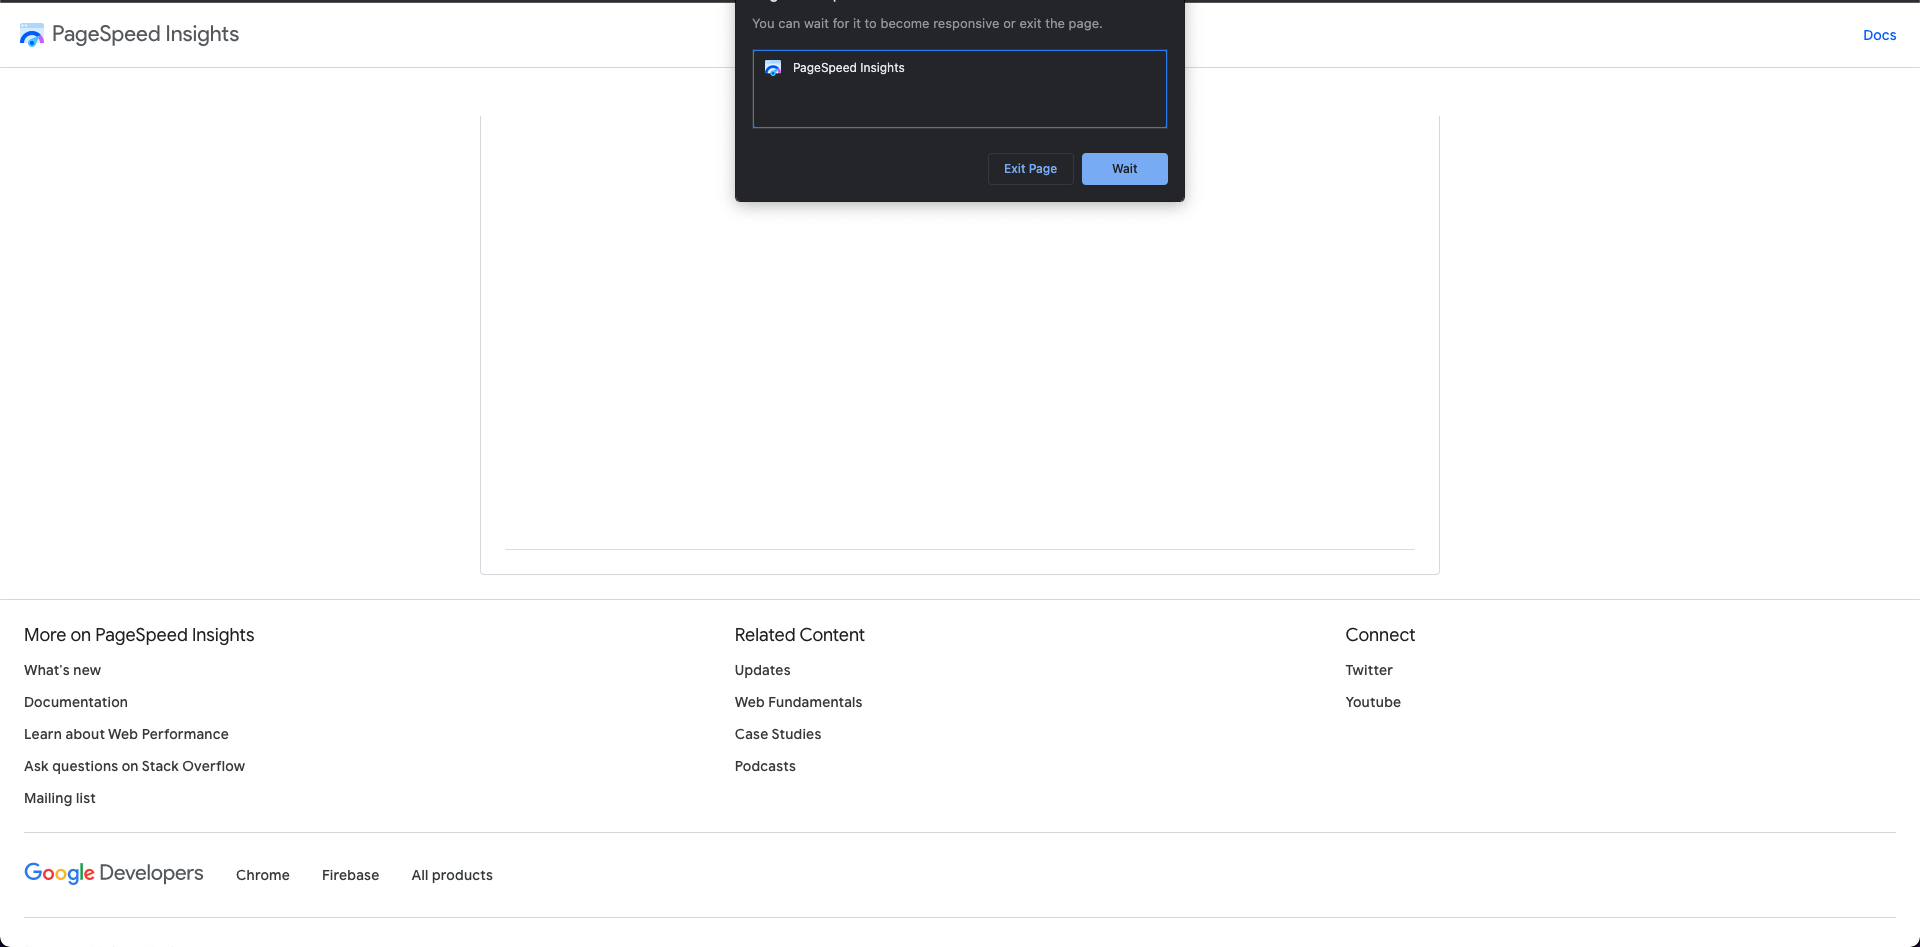
https://user-images.githubusercontent.com/6011865/149616607-6c5c4129-57cf-4a3d-8c97-cebb22d918a7.mov
### What did you expect?
That it will display the who statistics if the page along with Diagnostics and Audits
### What have you tried?
I have tried on incognito in chrome but it seems to be having issues in both.
On other browsers i.e. Safari and Brave it's working fine
### How were you running Lighthouse?
PageSpeed Insights
### Lighthouse Version
9.0.0
### Chrome Version
Version 97.0.4692.71 (Official Build) (x86_64)
### Node Version
_No response_
### OS
Mac OS Monetery
### Relevant log output
_No response_
Contributor guide
Research direction
Start by reproducing the report at the provided PageSpeed Insights URL in Chrome, following the Mobile-to-Desktop tab-switching steps. Compare the report with Safari or Brave and inspect which sections become blank before the page becomes unresponsive. Done means the Desktop report consistently shows its statistics, Diagnostics, and Audits after switching tabs.
Written by the indexing model from the issue text.
Assessment
- Tech stack
- javascript
- Domain
- performance, web-dev
- Issue type
- Bug
- Difficulty
- 4/5
- Estimated time
- 3-5 days
- Activity status
- Stale
- Clarity
- Mostly clear
- Newbie friendliness
- 25/100