GoogleChrome / GoogleChrome/lighthouse-ci
Compute the actual distribution of all metrics for dashboard
- Dominant language
- JavaScript
- Stars
- 7.1k
- Forks
- 716
- PR merge metrics
- No merged PRs in 30d
Description
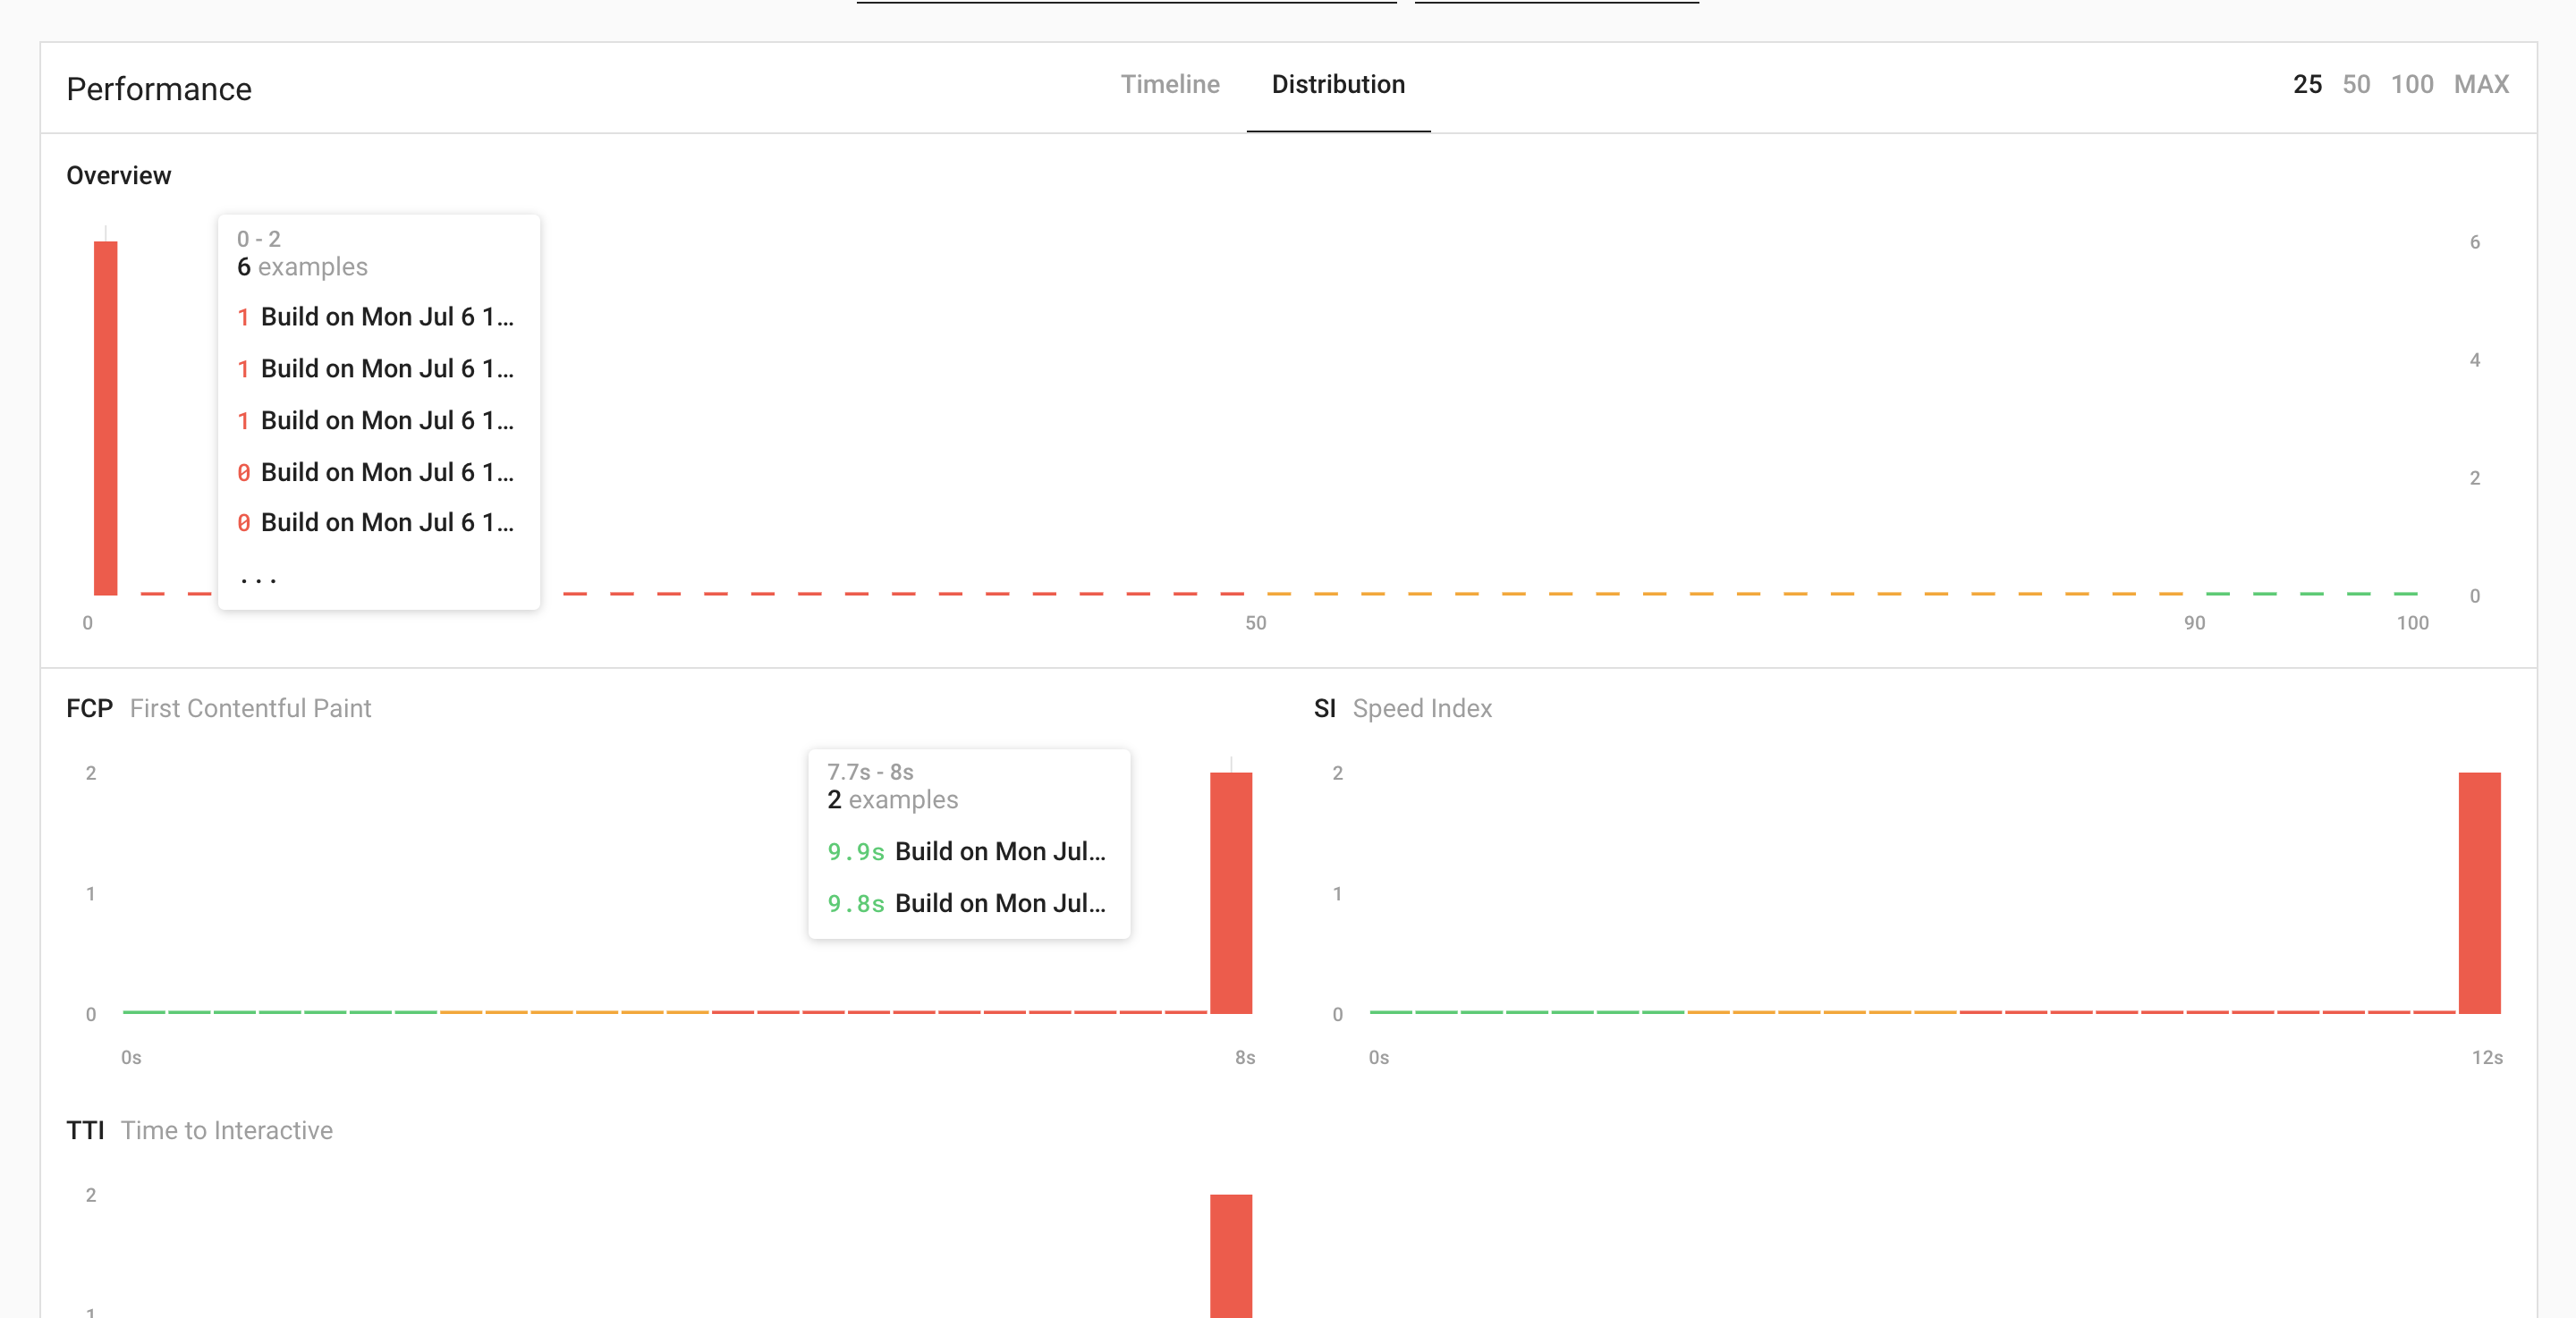
The lighthouse CI server's distribution graphs for categories (Performance, Accessibility,...) are not showing the number of examples rightly. I ran the lighthouse CI against the same URL across two different builds and so I got two entries in the "runs" table of the DB. But in the dashboard, the number of examples is shown as 6 instead of 2 with duplicate entries, whereas it is correctly shown for the performance metrics such as Speed Index, First Contentful Paint, and Time to Interactive. I also had a view on the "statistics" table of the DB, it had only two entries, one for each build.
I have two questions.
1. Is this a bug or an intentional one?
2. What happens if there are multiple runs (eg. 3) of the same URL in a single build? Will the median be used in that case for categories and performance metrics in the graphs?
Please find the image below.
Contributor guide
Assessment
This issue has not been assessed yet.