GenericMappingTools / GenericMappingTools/gmt
Vertical exaggeration for Profiles
- Dominant language
- C
- Stars
- 979
- Forks
- 414
- Avg merge
- 17h 26m
- Merged PRs (30d)
- 54
Description
This is a feature **suggest** in order to improve profiles. I have my commands to do it (in DOS, sorry, I will change to bash soon).
1. When I run basemap/plot the map scale is inform in the terminal. But in the case of a profile (-JX), that scale is the horizontal one and may NOT be the same as the vertical scale.
2. From the horizontal and vertical scale, a vertical exaggeration can be calculated.
Suggestions: The vertical scale and exaggeration could be shown in the terminal.
Is it possible to save that information (horizontal and vertical scales, and vertical exaggeration) so it can be plot in the figure? I have to do the maths, show the results in the terminal and them plot it with:
```
REM Factor for the Horizontal (FH) and Vertical (FV) to convert the graphic units (cm) to reals (m, km).
REM km-cm=100000, m-cm=100
SET FH=100000
SET FV=100
REM Save the variables to do the math
echo %Max% > "temp_Max"
echo %Min% > "temp_Min"
echo %H% > "temp_H"
echo %KM% > "temp_KM"
echo %L% > "temp_L"
REM Show in Terminal
REM --------------------------------------------------------------
echo Horizontal Scale=
gmt math "temp_KM" "temp_L" DIV %FH% MUL =
gmt math "temp_KM" "temp_L" DIV %FH% MUL = "temp_Esc_Hz"
echo Vertical Scale =
gmt math "temp_Max" "temp_Min" SUB "temp_H" DIV %FV% MUL =
gmt math "temp_Max" "temp_Min" SUB "temp_H" DIV %FV% MUL = "temp_Esc_Ve"
echo Vertical Exaggeration=
gmt math "temp_Esc_Hz" "temp_Esc_Ve" DIV =
REM Add info in the figure
REM -------------------------------------------------------------
REM Data from terminal
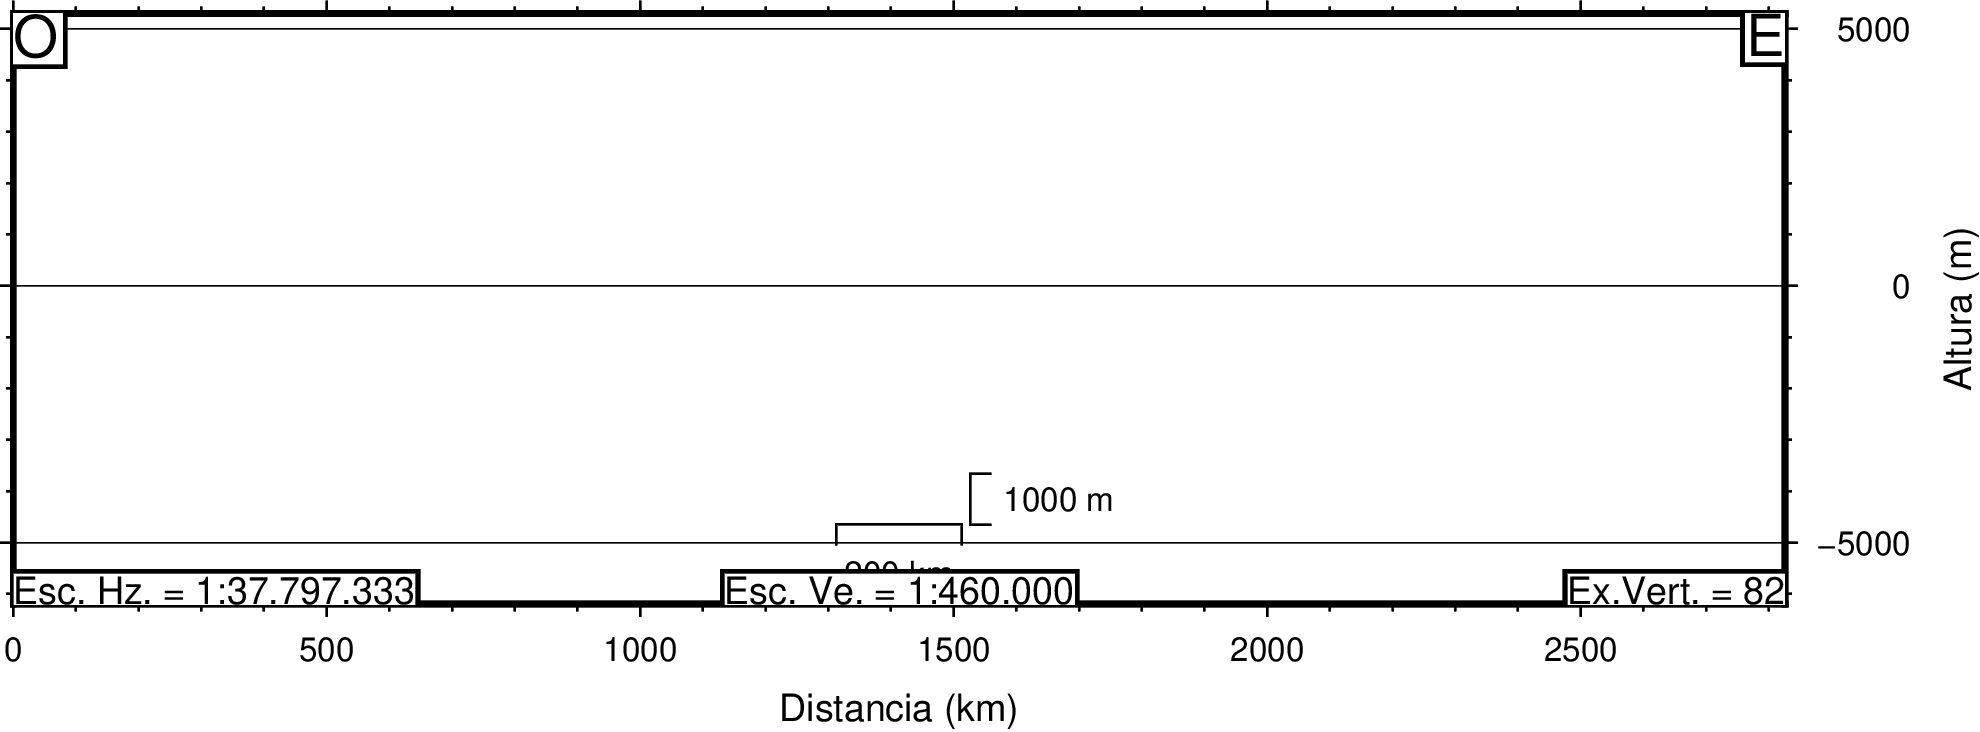
echo Esc. Hz. = 1:37.797.333 | gmt pstext -R -J -O -K -F+cBL+f9p -Gwhite -W1 >> %OUT%
echo Esc. Ve. = 1:460.000 | gmt pstext -R -J -O -K -F+cBC+f9p -Gwhite -W1 >> %OUT%
echo Ex.Vert. = 82 | gmt pstext -R -J -O -K -F+cBR+f9p -Gwhite -W1 >> %OUT%
```
******************
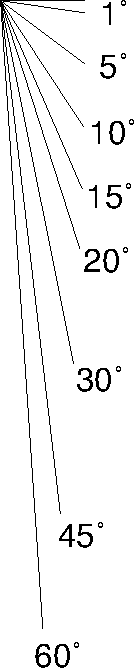
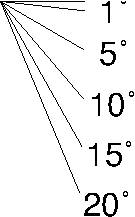
Also, I thik it would be nice to have a graphical vertical exaggeration. In other words, to show how the angles are deformed:
```
REM Angulos de Inclinacion
echo 0 0 > "temp_angulos"
echo 1 0 >> "temp_angulos"
echo > 1\232 >> "temp_angulos"
echo 0 0 >> "temp_angulos"
echo 1.000 0.017 >> "temp_angulos"
echo > 5\232 >> "temp_angulos"
echo 0 0 >> "temp_angulos"
echo 0.996 0.087 >> "temp_angulos"
echo >10\232 >> "temp_angulos"
echo 0 0 >> "temp_angulos"
echo 0.985 0.174 >> "temp_angulos"
echo >15\232 >> "temp_angulos"
echo 0 0 >> "temp_angulos"
echo 0.966 0.259 >> "temp_angulos"
echo >20\232 >> "temp_angulos"
gmt psxy -J -R -O -K >> %OUT% "temp_angulos" -Wthinnest
echo 1.000 0.017 1\232 | gmt pstext -R -J -O -K >> %OUT% -Xa0.25
echo 0.996 0.087 5\232 | gmt pstext -R -J -O -K >> %OUT% -Xa0.25 -Ya-0.02
echo 0.985 0.174 10\232 | gmt pstext -R -J -O -K >> %OUT% -Xa0.25 -Ya-0.04
echo 0.966 0.259 15\232 | gmt pstext -R -J -O -K >> %OUT% -Xa0.24 -Ya-0.06
echo 0.940 0.342 20\232 | gmt pstext -R -J -O -K >> %OUT% -Xa0.23 -Ya-0.09
```
Batch script for the angles figures (with extension change to txt): [Angles_Vertical_Exaggeration.txt](https://github.com/GenericMappingTools/gmt/files/5432366/Angles_Vertical_Exaggeration.txt)
Contributor guide
Assessment
This issue has not been assessed yet.