GenericMappingTools / GenericMappingTools/gmt
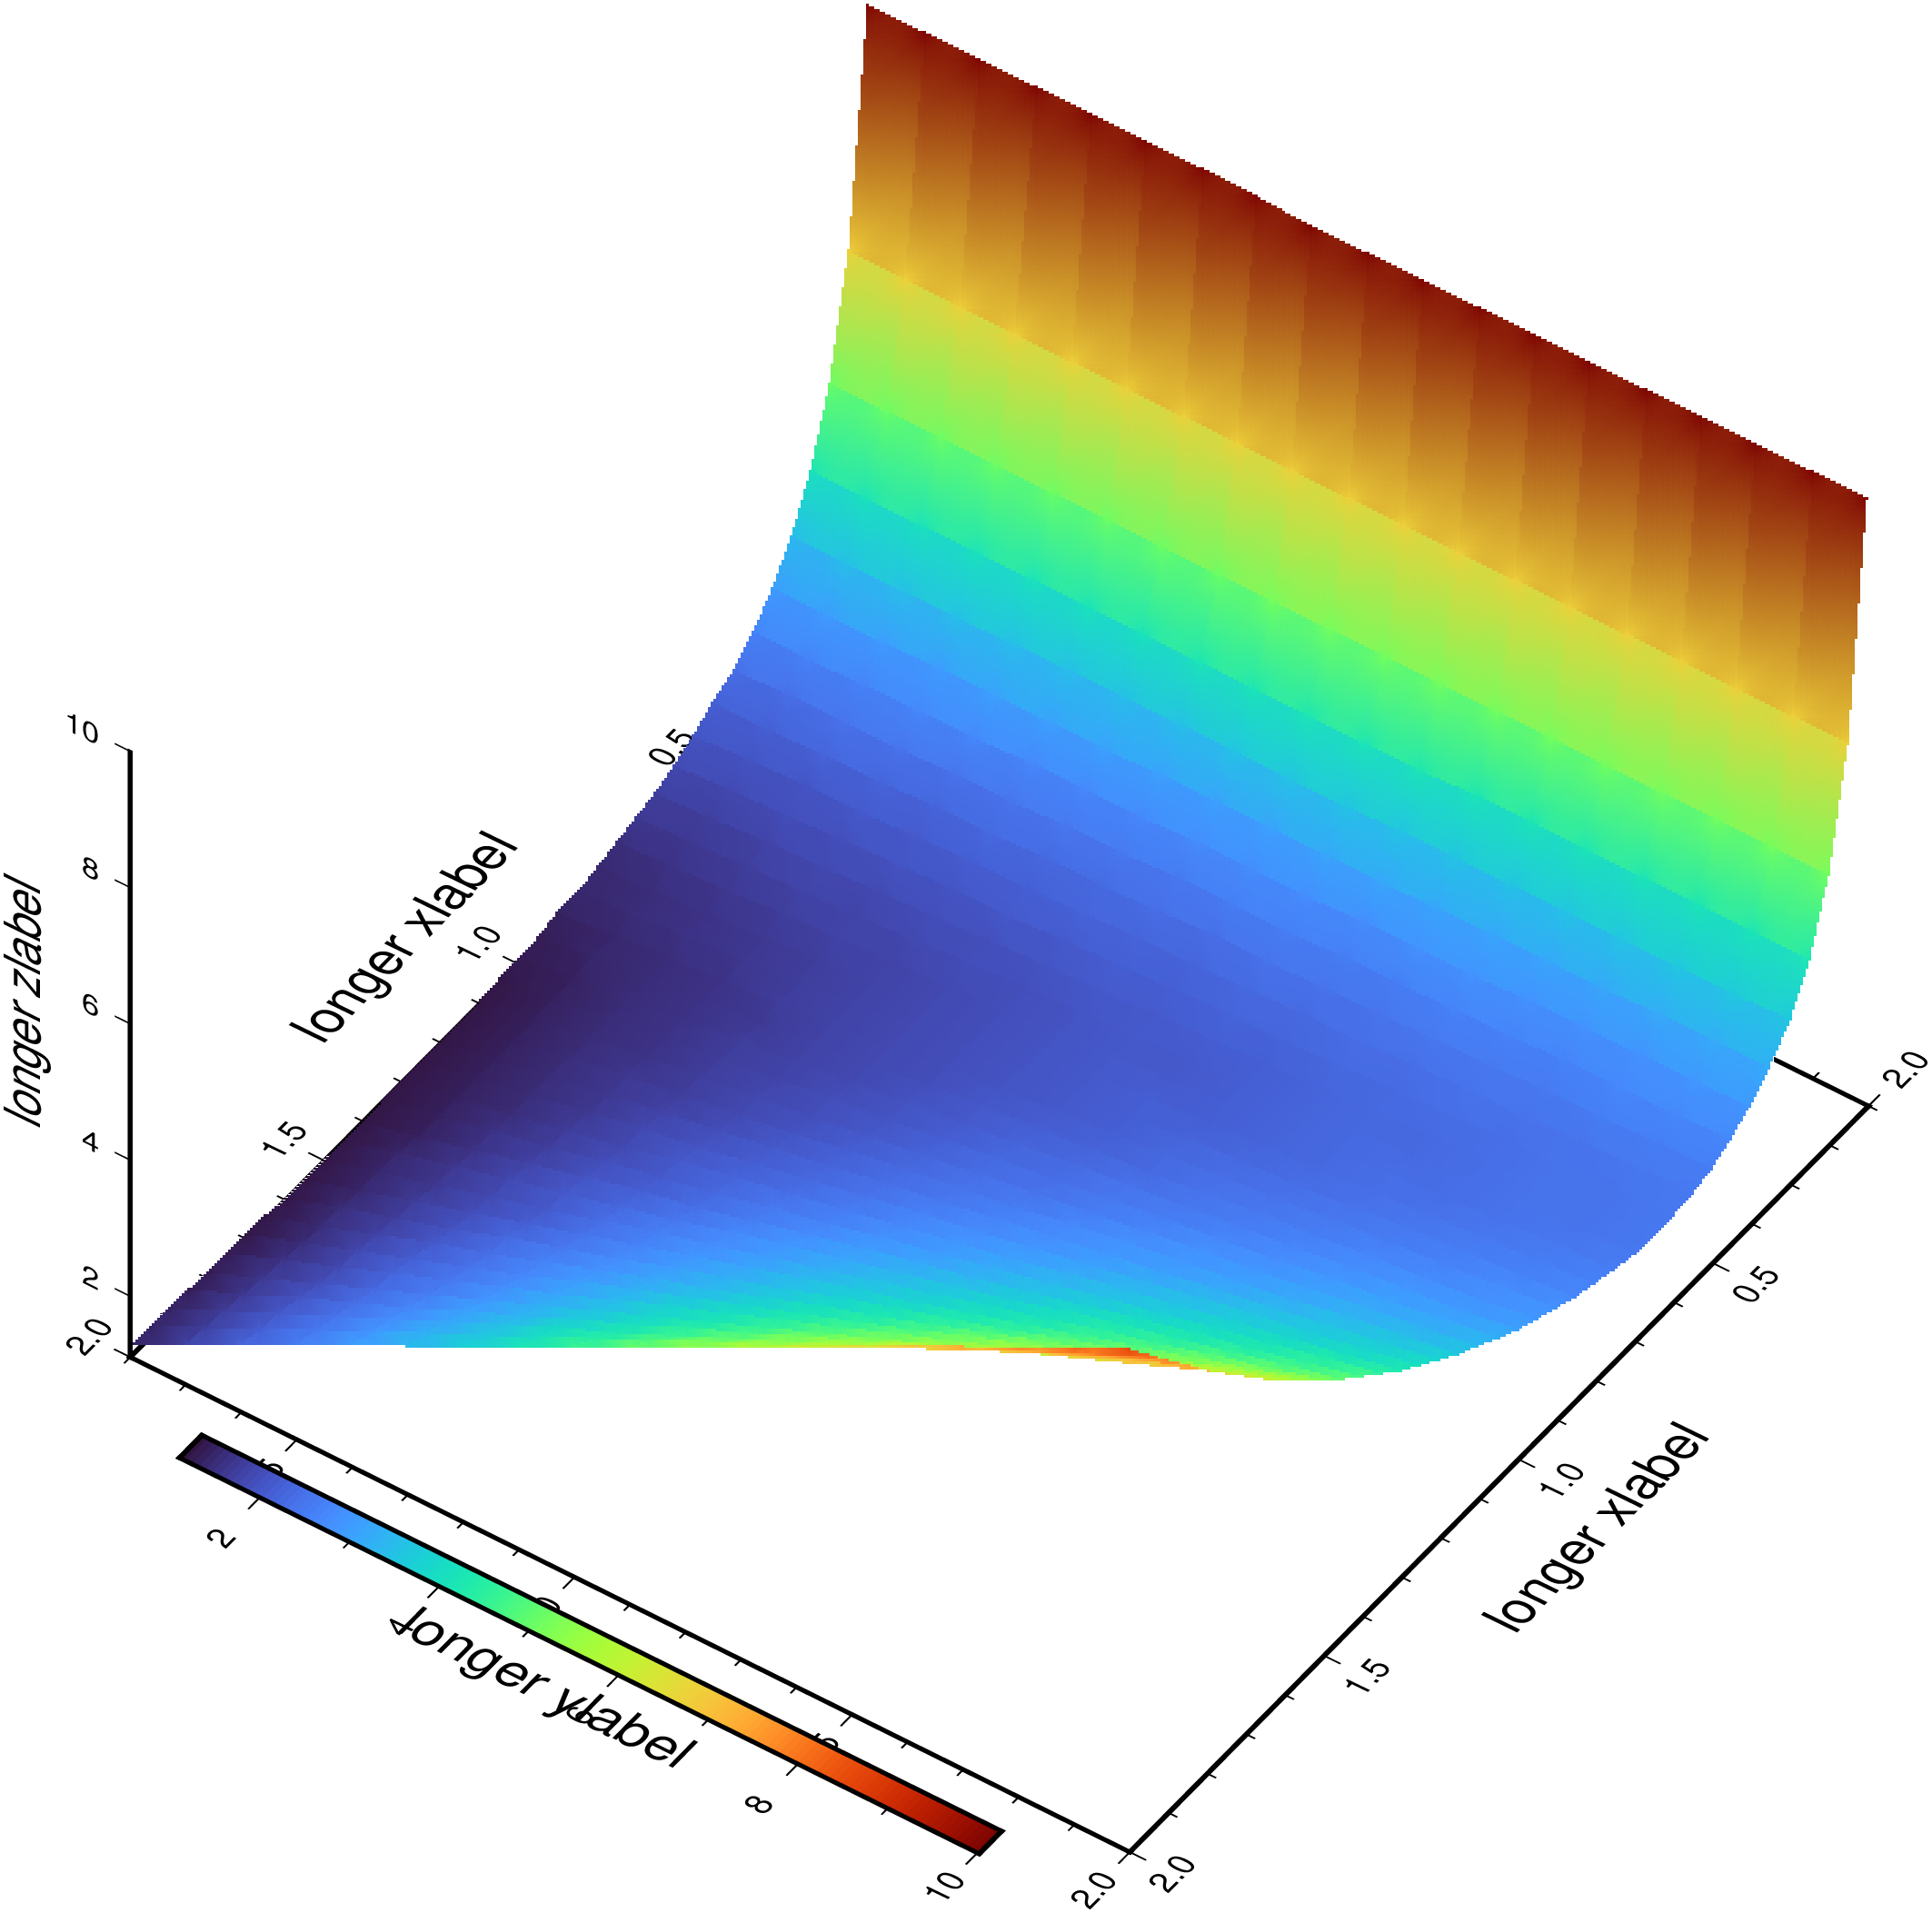
colorbar overlaping annotations
- Dominant language
- C
- Stars
- 979
- Forks
- 414
- Avg merge
- 17h 26m
- Merged PRs (30d)
- 54
Description
Note, GMT.jl master version is needed to reproduce this example.
We also lack an option to plot the colorbar parallel to the vertical *z-axis*
```
julia> imshow((x,y) -> 1/x + y*x^2, 0.1:0.05:2.0, 0.2:0.1:2.0, xlabel="longer xlabel", ylabel="longer ylabel", zlabel="longer zlabel", view=(55,45), colorbar=true, Vd=1, fmt=:png)
["grdview -JX12c/0 -Baf -Bza -Bx+l\"longer xlabel\" -By+l\"longer ylabel\" -Bz+l\"longer zlabel\" -p55/45 -Qi100 -JZ8 -R0.1/2/0.2/2 -C -P -K > C:\\TMP\\GMTjl_tmp.ps", "psscale -R -J -Baf -p55/45 -DJMR -C -K -O >> C:\\TMP\\GMTjl_tmp.ps"]
```
Contributor guide
Assessment
This issue has not been assessed yet.