FormidableLabs / FormidableLabs/victory
[Performance] frame rate drops when zooming on large data sets
- Dominant language
- TypeScript
- Stars
- 11.2k
- Forks
- 536
- PR merge metrics
- No merged PRs in 30d
Description
Hi, I tried swapping out d3 for victory for the SSR support. (I was able to write dramatically less code, which is awesome 👍 ).
Everything looks great, except for a performance issue I encountered. I made a `VictoryLine` with a data set of ~1,000 (x, y) points and I'm seeing low frame rates in victory (~6 fps) I wasn't observing with d3 (~60 fps). Here's the code (lightly edited):
```js
import VictoryChart from 'victory-chart/es/components/victory-chart/victory-chart';
import VictoryLine from 'victory-chart/es/components/victory-line/victory-line';
import VictoryZoomContainer from 'victory-chart/es/components/containers/victory-zoom-container';
let dates = [
Number(new Date(2017, 6, 11, 3, 24, 0)),
Number(new Date(2017, 6, 12, 1, 24, 0)),
Number(new Date(2017, 6, 13, 7, 24, 0)),
Number(new Date(2017, 6, 14, 2, 24, 0)),
Number(new Date(2017, 6, 15, 11, 44, 0))
];
for (let i = 0; i <= 1000; i += 1) {
dates.push(Number(new Date(2017, 6, 15, 11, 44, 0)));
}
const data = dates.reduce((array, date) => {
let cumulative = 1;
if (array.length > 0) {
cumulative += array[array.length - 1].y;
}
array.push({
x: date,
y: cumulative
});
return array;
}, []);
function VictoryChartWithLotsOfData() {
return (
}
>
);
}
```
Renders were about ~6 fps. Here's a screenshot of the performance tab in Chrome dev tools:
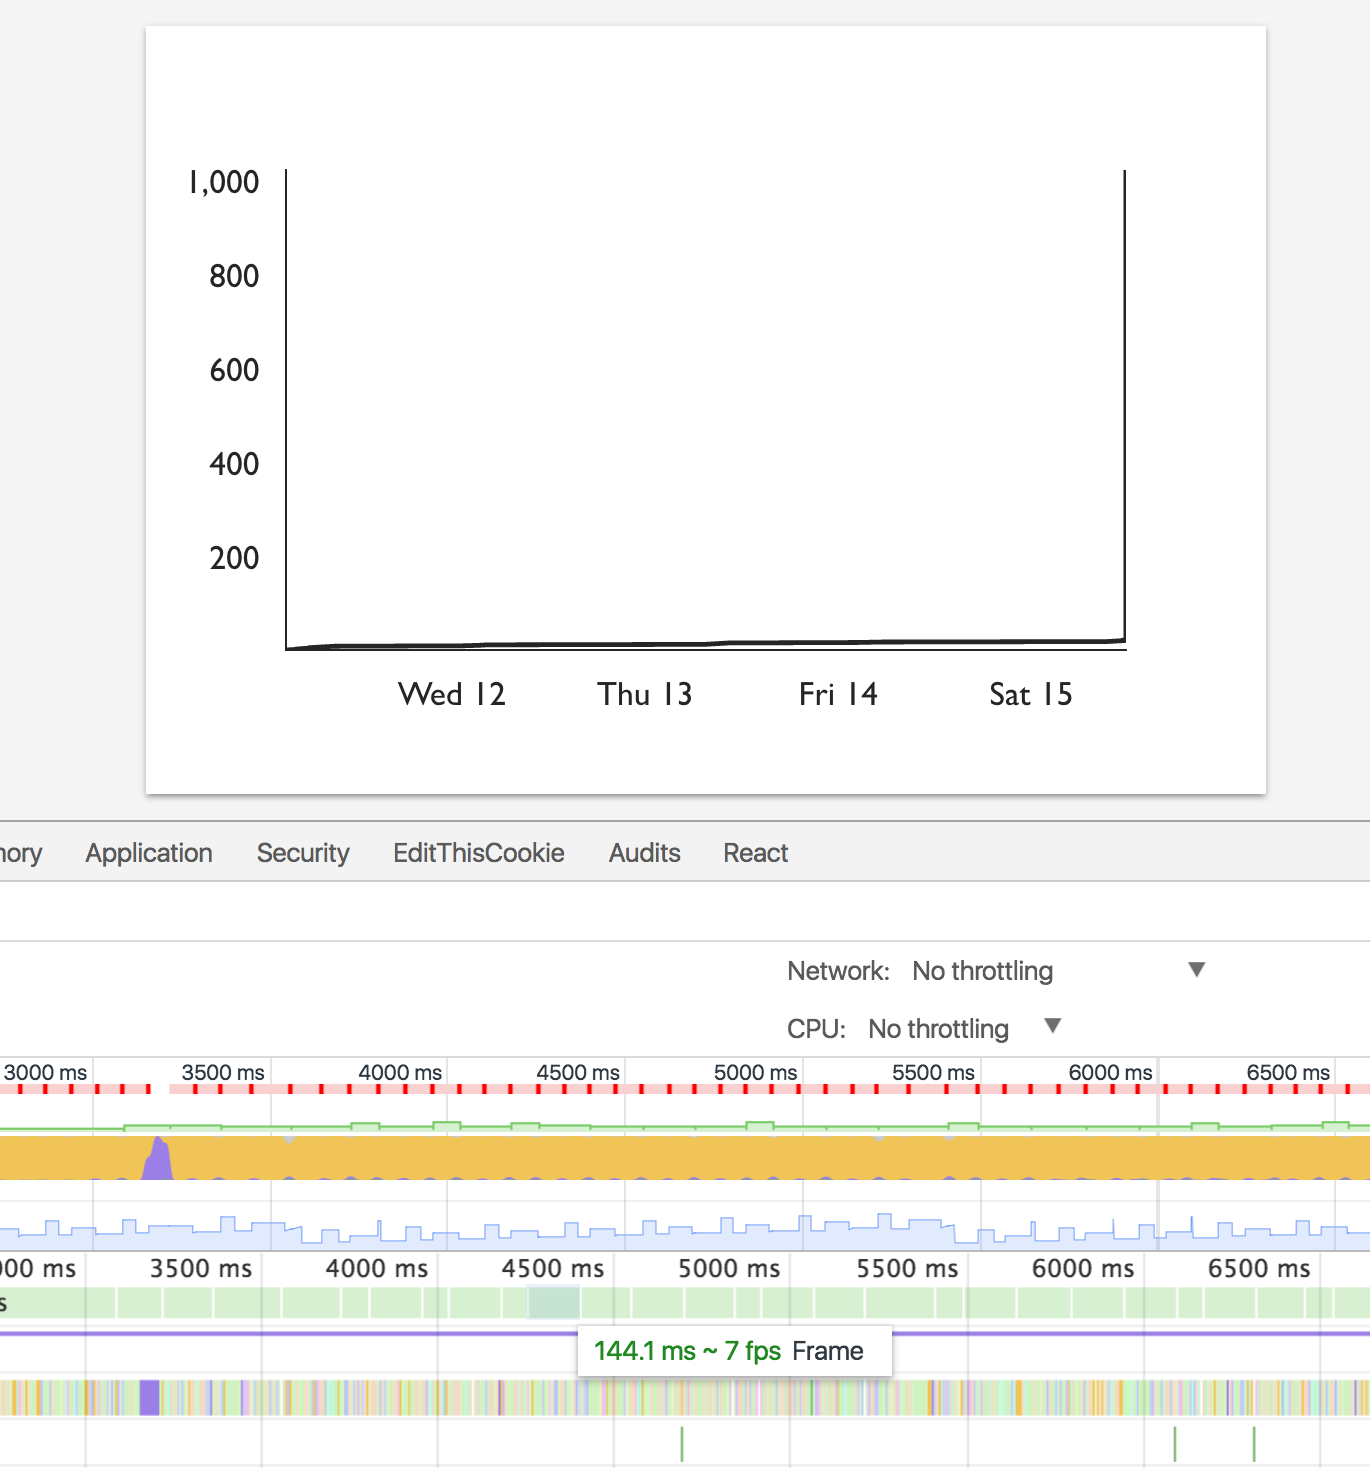
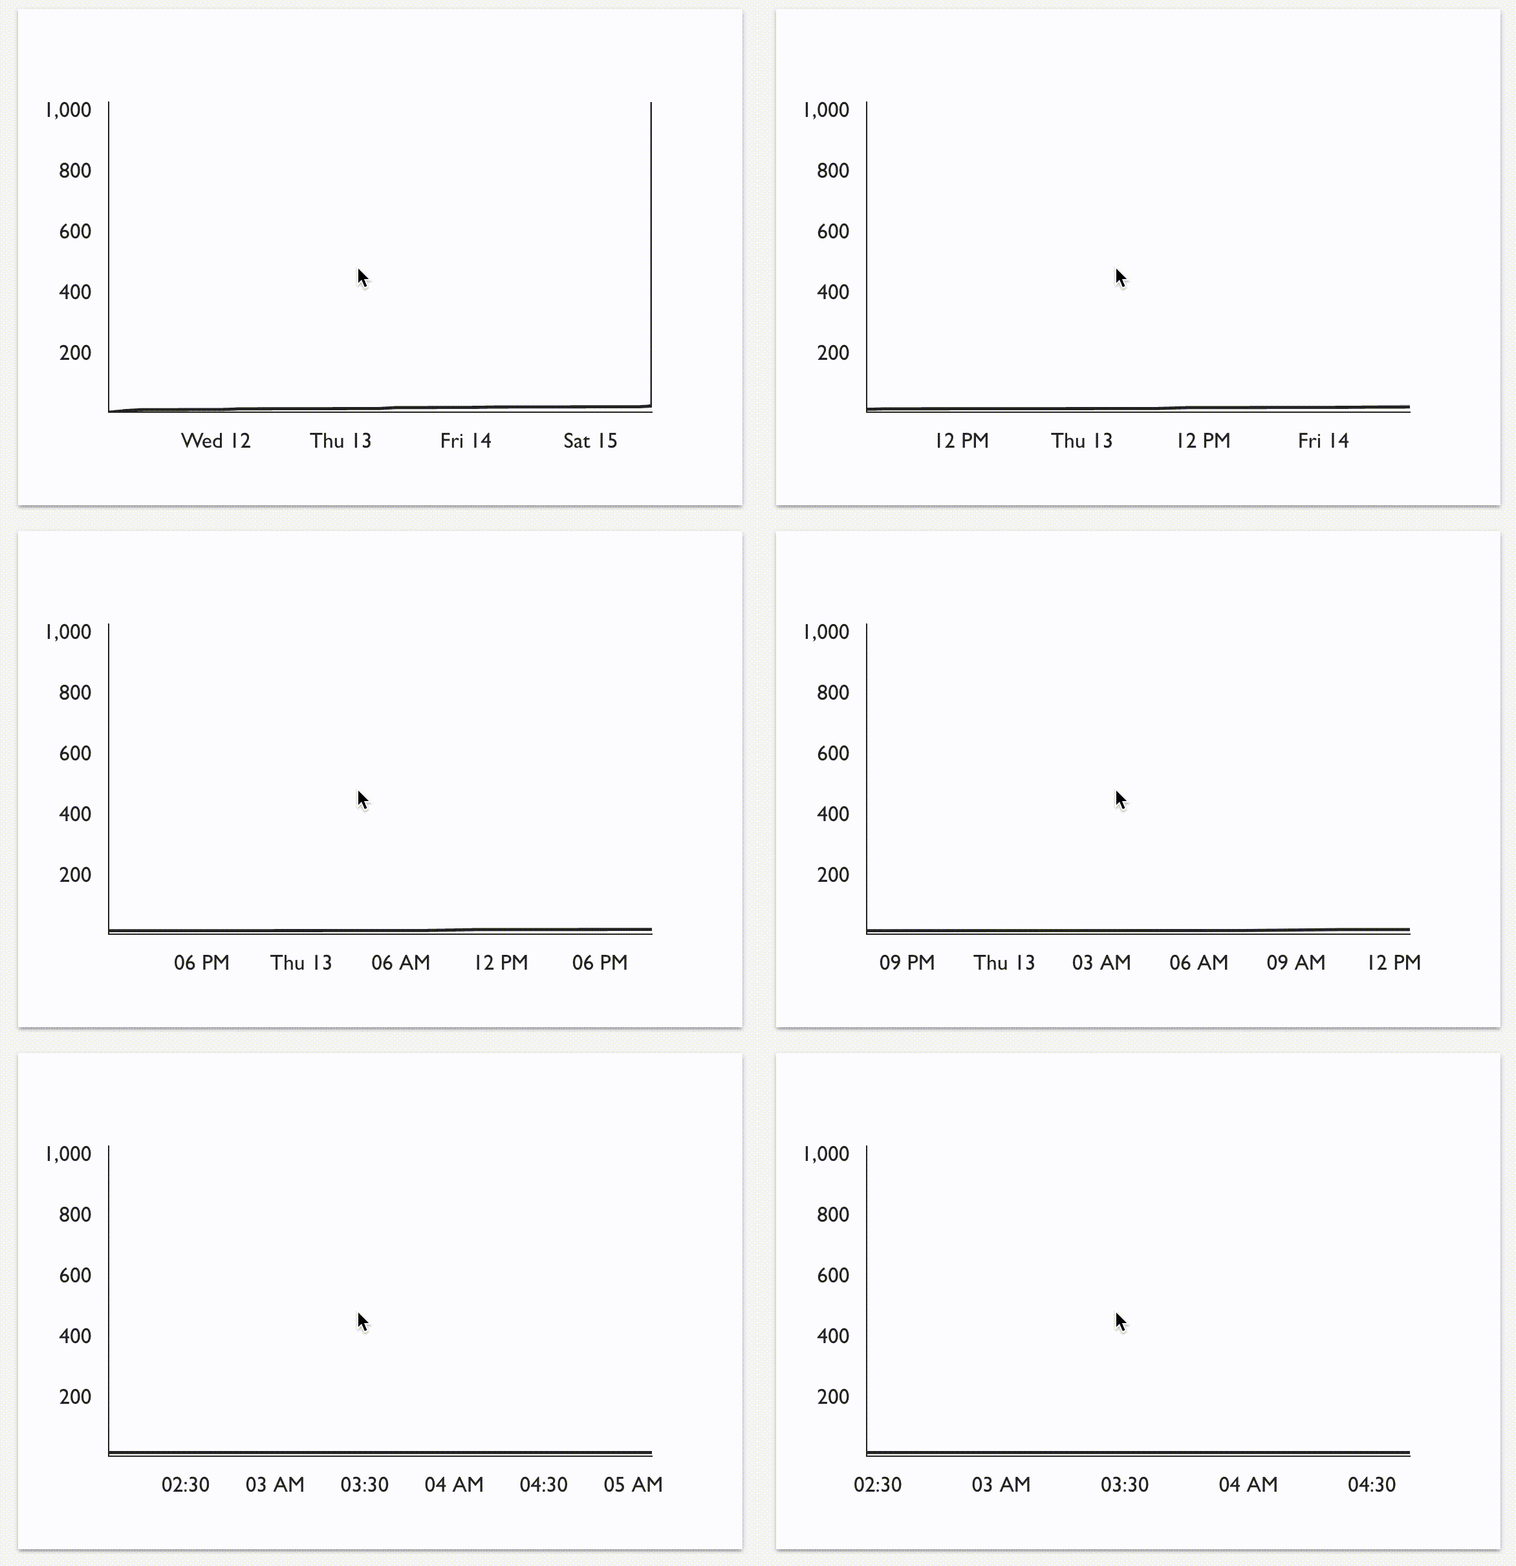
And the animation itself. You can observe the dropped frames in the x-axis labels:
This performance issue would block me from adopting Victory today, but it's something I think can be fixed. Otherwise, it is 100% what I'm looking for.
Contributor guide
Assessment
This issue has not been assessed yet.