Create a Pie chart from a single feature of attributes
- Dominant language
- Handlebars
- Stars
- 265
- Forks
- 236
- PR merge metrics
- No merged PRs in 30d
Description
We want to create a pie chart like:
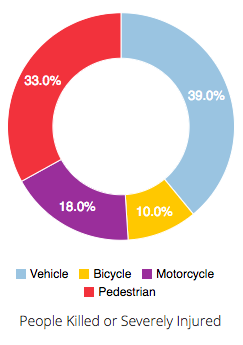
Using the [LA Collision Layer](http://geohub.lacity.org/datasets/bed43aa2945a47b18ae888246712ccb1_0)
[Query for aggregations](https://services1.arcgis.com/tp9wqSVX1AitKgjd/arcgis/rest/services/roadsafegis_20092013/FeatureServer/0/query?where=1%3D1&returnGeometry=false&returnDistinctValues=false&returnIdsOnly=false&returnCountOnly=false&outFields=*&sqlFormat=standard&f=json&outStatistics=%5B%7B%22statisticType%22%3A%22sum%22%2C%22onStatisticField%22%3A%22COUNT_BICYCLIST_INJURED%22%2C%22outStatisticFieldName%22%3A%22COUNT_BICYCLIST_INJURED_SUM%22%7D%2C%7B%22statisticType%22%3A%22sum%22%2C%22onStatisticField%22%3A%22COUNT_PED_INJURED%22%2C%22outStatisticFieldName%22%3A%22COUNT_PED_INJURED_SUM%22%7D%2C%7B%22statisticType%22%3A%22sum%22%2C%22onStatisticField%22%3A%22COUNT_MC_INJURED%22%2C%22outStatisticFieldName%22%3A%22COUNT_MC_INJURED_SUM%22%7D%5D) response is:
```json
{
"objectIdFieldName": "OBJECTID",
"globalIdFieldName": "",
"geometryType": "esriGeometryPoint",
"spatialReference": {
"wkid": 4326,
"latestWkid": 4326
},
"fields": [
{
"name": "COUNT_BICYCLIST_INJURED_SUM",
"type": "esriFieldTypeDouble",
"alias": "COUNT_BICYCLIST_INJURED_SUM",
"sqlType": "sqlTypeFloat",
"domain": null,
"defaultValue": null
},
{
"name": "COUNT_PED_INJURED_SUM",
"type": "esriFieldTypeDouble",
"alias": "COUNT_PED_INJURED_SUM",
"sqlType": "sqlTypeFloat",
"domain": null,
"defaultValue": null
},
{
"name": "COUNT_MC_INJURED_SUM",
"type": "esriFieldTypeDouble",
"alias": "COUNT_MC_INJURED_SUM",
"sqlType": "sqlTypeFloat",
"domain": null,
"defaultValue": null
}
],
"features": [
{
"attributes": {
"COUNT_BICYCLIST_INJURED_SUM": 10643,
"COUNT_PED_INJURED_SUM": 13392,
"COUNT_MC_INJURED_SUM": 5130
}
}
]
}
```
## Chart JSON
But what is the chart JSON that should work here? It really is a single series powered by the single feature response. But we need to apply an alias label as well. So here are a few option ideas
### Option 1 - value array
```json
{
"type": "pie",
"datasets": [
{
"url": "https://services1.arcgis.com/tp9wqSVX1AitKgjd/arcgis/rest/services/roadsafegis_20092013/FeatureServer/0",
"query": {
"outStatistics": [
{
"statisticType": "sum",
"onStatisticField": "COUNT_BICYCLIST_INJURED",
"outStatisticFieldName": "COUNT_BICYCLIST_INJURED_SUM"
},
{
"statisticType": "sum",
"onStatisticField": "COUNT_PED_INJURED",
"outStatisticFieldName": "COUNT_PED_INJURED_SUM"
},
{
"statisticType": "sum",
"onStatisticField": "COUNT_MC_INJURED",
"outStatisticFieldName": "COUNT_MC_INJURED_SUM"
}
]
}
}
],
"series": [
{
"value": [
{ "field": "COUNT_BICYCLIST_INJURED_SUM", "label": "Bicycle Injured"}
{ "field": "COUNT_PED_INJURED_SUM", "label": "Pedestrian Injured"}
{ "field": "COUNT_MC_INJURED_SUM", "label": "Motor Vehicle Injured"}
]
}
]
}
```
### Option 2 - multiple series
```json
{
"type": "pie",
"datasets": [
{
"url": "https://services1.arcgis.com/tp9wqSVX1AitKgjd/arcgis/rest/services/roadsafegis_20092013/FeatureServer/0",
"query": {
"outStatistics": [
{
"statisticType": "sum",
"onStatisticField": "COUNT_BICYCLIST_INJURED",
"outStatisticFieldName": "COUNT_BICYCLIST_INJURED_SUM"
},
{
"statisticType": "sum",
"onStatisticField": "COUNT_PED_INJURED",
"outStatisticFieldName": "COUNT_PED_INJURED_SUM"
},
{
"statisticType": "sum",
"onStatisticField": "COUNT_MC_INJURED",
"outStatisticFieldName": "COUNT_MC_INJURED_SUM"
}
]
}
}
],
"series": [
{
"value": {
"field": "COUNT_BICYCLIST_INJURED_SUM",
"label": "Bicycle Injured"
}
},{
"value": {
"field": "COUNT_PED_INJURED_SUM",
"label": "Pedestrian Injured"
}
},{
"value": {
"field": "COUNT_MC_INJURED_SUM",
"label": "Motor Vehicle Injured"
}
}
]
}
```
Neither of these is great yet, but starting the conversation @tomwayson @benstoltz
Contributor guide
No contributing guide indexed for this repository
Assessment
This issue has not been assessed yet.