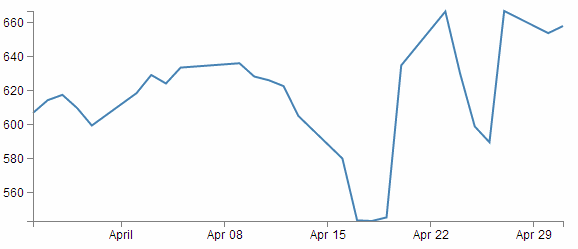
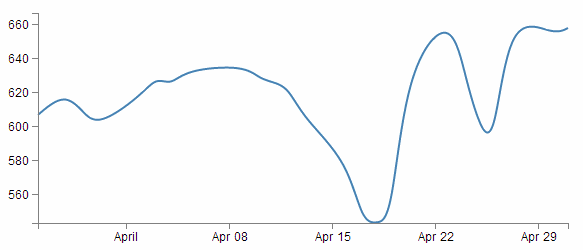
Possible to smooth lines in linechart?
- Dominant language
- Handlebars
- Stars
- 265
- Forks
- 236
- PR merge metrics
- No merged PRs in 30d
Description
Was reading up on D3 and spotted [this post](http://www.d3noob.org/2013/01/smoothing-out-lines-in-d3js.html).
Is there an easy way to apply the line.interpolate("effect") to a cedar chart?
```
var valueline = d3.svg.line()
.interpolate("basis") // <=== THERE IT IS!
.x(function(d) { return x(d.date); })
.y(function(d) { return y(d.close); });
```
Contributor guide
No contributing guide indexed for this repository
Research direction
Start by tracing how Cedar creates its line charts and compare that path with the D3 line generator example in the issue, especially the interpolate setting. Determine where a smoothing option would belong and define done as applying the requested interpolation to a Cedar line chart without breaking existing chart behavior.
Written by the indexing model from the issue text.
Assessment
- Tech stack
- d3, javascript
- Domain
- data-visualization, frontend
- Issue type
- Feature
- Difficulty
- 3/5
- Estimated time
- 1-2 days
- Activity status
- Stale
- Clarity
- Needs clarification
- Newbie friendliness
- 35/100