how to define steps to leftAxis
- Dominant language
- Swift
- Stars
- 28k
- Forks
- 6k
- PR merge metrics
- No merged PRs in 30d
Description
I am trying to create a line chart
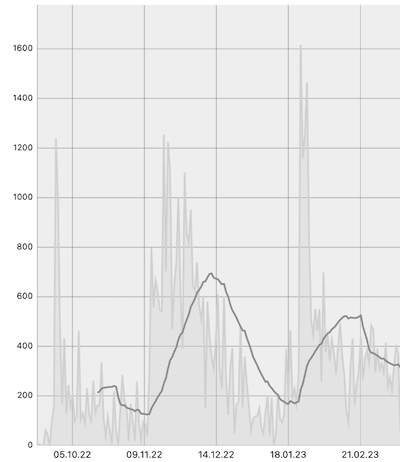
This works quite well so far. However, I cannot set the values on the left axis in 250 steps as desired.You can see my last attempt here:
```
ChartYAxis *leftAxis = self.lineChartView.leftAxis;
leftAxis.labelTextColor = [UIColor colorNamed:@"ColorGraphSD"];
leftAxis.axisMinimum = 0;
leftAxis.axisMaximum = ceil(maxValue / 250.0) * 250;
leftAxis.drawGridLinesEnabled = YES;
leftAxis.drawZeroLineEnabled = NO;
leftAxis.granularityEnabled = NO;
leftAxis.granularity = .1;
leftAxis.axisRange = 250;
leftAxis.labelCount = ceil(maxValue / 250.0);
```
Debugger tells me leftAxis.labelCount = 8; and leftAxis.axisMaximum = 2000;
All I want is a line at 259,500,750....
How to do that?
Contributor guide
Research direction
Start with ChartYAxis and the shown axisMinimum, axisMaximum, granularity, axisRange, and labelCount settings; trace how axis labels and grid lines are generated. Confirm the configuration needed for labels at 0, 250, 500 and subsequent 250-point intervals, then verify it against the attached chart example.
Written by the indexing model from the issue text.
Assessment
- Tech stack
- swift
- Domain
- data-visualization, mobile-dev
- Issue type
- Bug
- Difficulty
- 2/5
- Estimated time
- 1-3 hours
- Activity status
- Stale
- Clarity
- Mostly clear
- Newbie friendliness
- 35/100