Unable to set x-axis valueformatter for multiple month dates - iOS
- Dominant language
- Swift
- Stars
- 28k
- Forks
- 6k
- PR merge metrics
- No merged PRs in 30d
Description
## What did you do?
I tried to set x-axis with date format in the bar chart view.
I tried below code in the multi-bar chart it is working fine but for Bar chart isn't working.
```
xaxis.valueFormatter = IndexAxisValueFormatter(values: dates)
\\ Here the dates are our array of dates for different days. (It can be different months)
Eg:- X-axis:- 12,15,17,19,30,1,2,3,4
```
## What did you expect to happen?
We want the bar chart to be drawn on the respective date on the x-axis.
## What happened instead?
The graph is drawn after the dates.
i.e First all dates are shown in graph then bar chart getting drawn and also if we have two same date for different month then we are getting only single date in x-axis.
## Charts Environment
**Charts version/Branch/Commit Number:** 4.1.0
**Xcode version:** 14.1
**Swift version:** Swift 5
**Platform(s) running Charts:** iOS
**macOS version running Xcode:** -
## Demo Project
I attached screenshot & video of bar chart graph.
Have a look.
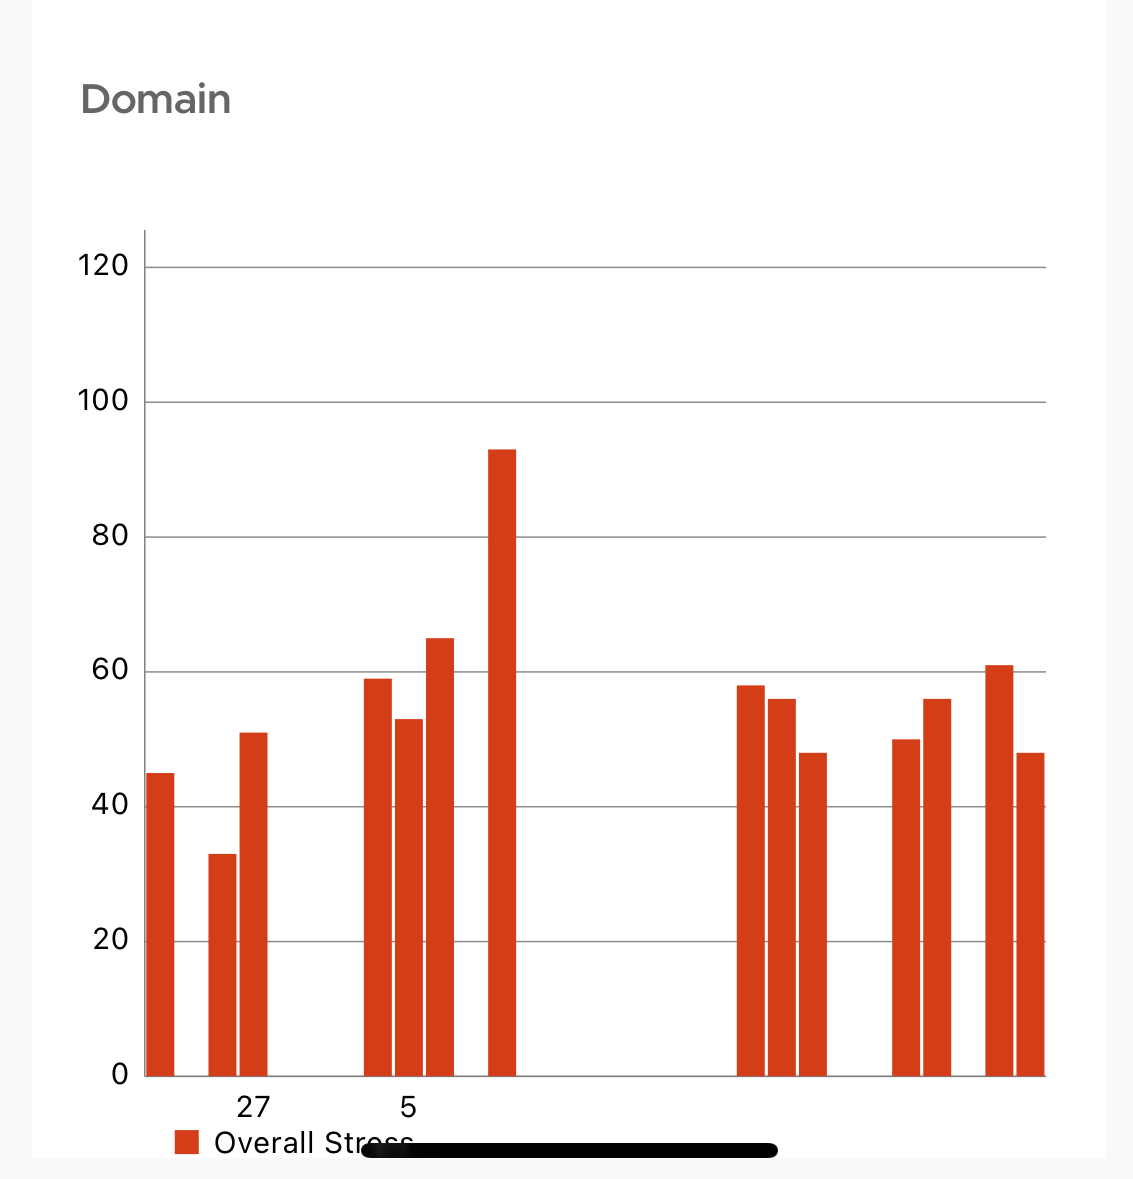
- Here in the video you can see that bar graph isn't drawn with respective date.
- When we zoom in we seen the other dates which were not showing in zoom out.
- We have provided date 1/12/2022 to 10/10/2023 in the bar graph.
https://user-images.githubusercontent.com/116279510/212046771-56bb4a32-6efb-46e2-a73f-bd1240c1e2e4.mov
Contributor guide
Assessment
This issue has not been assessed yet.