BarChart: groupBars is breaking the x Axis
- Dominant language
- Swift
- Stars
- 28k
- Forks
- 6k
- PR merge metrics
- No merged PRs in 30d
Description
* [x] I've read, understood, and done my best to follow the [*CONTRIBUTING guidelines](https://github.com/jjatie/Charts/blob/master/CONTRIBUTING.md).
## What did you do?
Trying to create a grouped bar chart with 2 columns in a group. At some point, I am using
`data.barData.groupBars(fromX: minX, groupSpace: groupSpace, barSpace: barSpace)`
code to perform the grouping of bars. But the result is unsatisfying in case when there are data gaps in the dataset entries.
So before calling the `groupBars` function I have this data set.
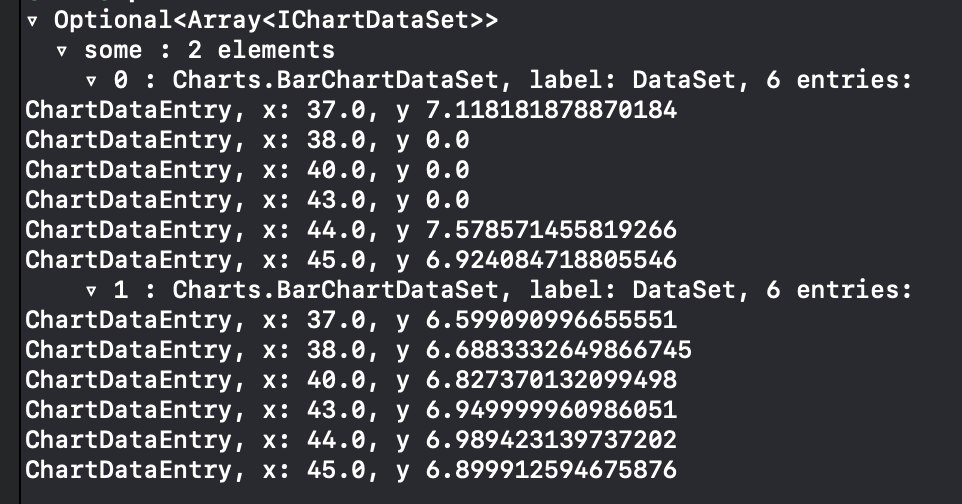
And after calling the `groupBars` function the result is the following:
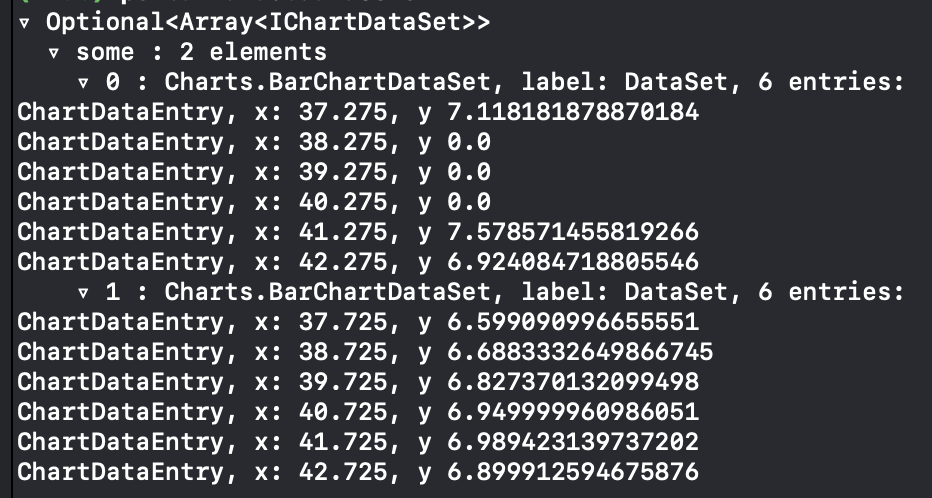
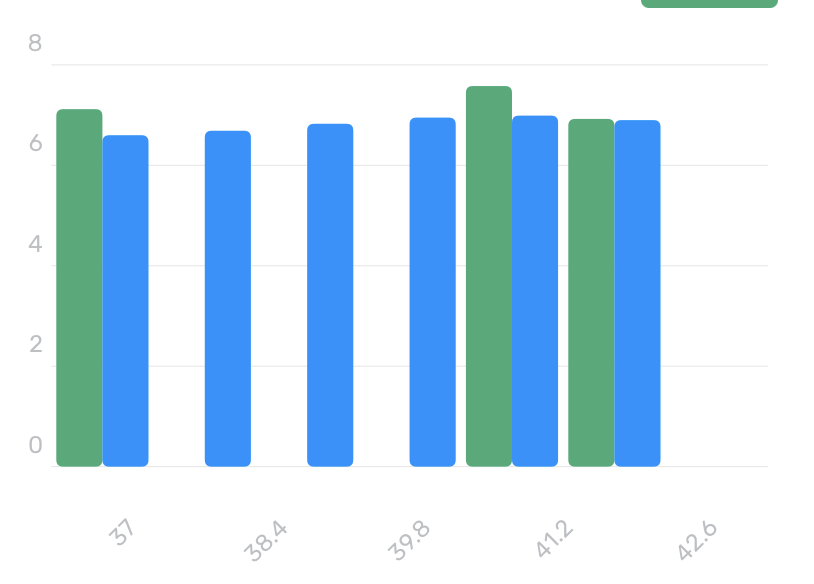
As you can see, in the original part, the x axis should start at 37 and end at 45, having missing values = [39, 41, 42].
After grouping, the values for x axis start at 37.275 and ends up at 42.275.
## What did you expect to happen?
Expecting the have a chart with the following x Axis values: 37, 38, 39, 40, 41, 42, 43, 44, 45
## What happened instead?
Instead I have 37.x, 38.x, 39.x, 40.x, 41.x, 42.x
## Charts Environment
**Charts version/Branch/Commit Number:** 3.6.0 but the same result is with 4.1.0
**Xcode version:** 13.4.1
**Swift version:** 5.0
**Platform(s) running Charts:** iOS
**macOS version running Xcode:**
## Demo Project
X Axis configuration code
```
xAxis.drawAxisLineEnabled = false
xAxis.drawGridLinesEnabled = false
xAxis.labelFont = .rubikRegular(of: 12)
xAxis.labelTextColor = UIColor.lightGrayFour
xAxis.granularity = 1
xAxis.granularityEnabled = true
xAxis.drawLabelsEnabled = true
xAxis.centerAxisLabelsEnabled = true
xAxis.spaceMin = 1
xAxis.labelTextColor = .lightGrayFour
xAxis.labelPosition = .bottom
```
Other chart configuration code
```
extraTopOffset = 20
drawValueAboveBarEnabled = false
highlightPerDragEnabled = false
highlightPerTapEnabled = false
highlightFullBarEnabled = true
dragEnabled = false
dragXEnabled = true
addLongPressureGesture()
addPanGestureDidEndHandling()
scaleYEnabled = false
scaleXEnabled = true
legend.enabled = false
```
Bars rendering code
```
self.xAxis.resetCustomAxisMin()
self.xAxis.resetCustomAxisMax()
setVisibleXRangeMaximum(1)
setVisibleXRangeMinimum(min(7, Double(entriesCount) + 1))
let allEntries = dataSetItems.flatMap { $0.entries.compactMap { $0.copy() as? BarChartDataEntry } }
// (barSpace + barWidth)*colsCount + groupSpace = 1.0
let groupSpace = 0.1
let barSpace = 0.0
let barWidth = ((1.0 - groupSpace)/Double(dataSets.count) - barSpace)
data.barData.barWidth = barWidth
let minX = allEntries.map { $0.x }.min() ?? 0
let groupsCount = Set(allEntries.map { $0.x }).count
data.barData.groupBars(fromX: minX, groupSpace: groupSpace, barSpace: barSpace)
xAxis.axisMinimum = minX
xAxis.axisMaximum = minX + data.barData.groupWidth(groupSpace: groupSpace, barSpace: barSpace) * Double(groupsCount)
notifyDataSetChanged()
```
Contributor guide
Assessment
This issue has not been assessed yet.