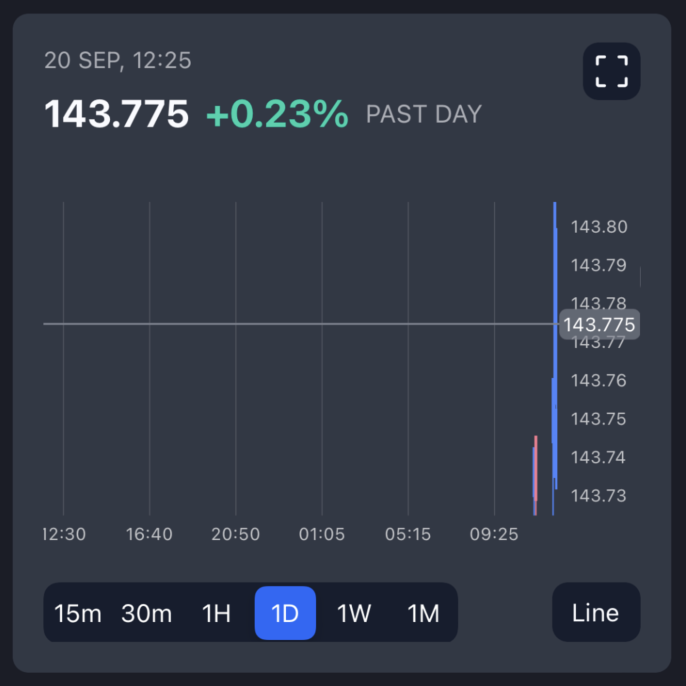
Line chart, only the last data set is visible on the diagram
- Dominant language
- Swift
- Stars
- 28k
- Forks
- 6k
- PR merge metrics
- No merged PRs in 30d
Description
- We are trying to update the Chart library from 3.6.0 version to 4.1.0. During the update process we have experienced some incompatibility issues and successfully fixed them. However, after the version update our graph does not work correctly, as it did before.
- We can see only the last 3 values in the candle diagram.
- Using a line chart we expect to see all values to be provided in the diagram.
## Charts Environment
**Charts version/Branch/Commit Number: 4.1.0, master branch
**Xcode version: Version 13.2.1 (13C100)
**Swift version: 5
**Platform(s) running Charts: iOS
**macOS version running Xcode: macOS Monterey Version 12.0.1
- We have attached the screenshots. The first one - when the graph is loaded. The second one - when values are updated (as well as graph)

Contributor guide
Research direction
Reproduce the issue with Charts 4.1.0 on iOS using a line chart whose values are updated, comparing the initial render with the updated graph. Check why only the last three values remain visible; done means all provided values appear correctly after updates.
Written by the indexing model from the issue text.
Assessment
- Tech stack
- ios, swift
- Domain
- mobile-dev
- Issue type
- Bug
- Difficulty
- 3/5
- Estimated time
- 1-2 days
- Activity status
- Stale
- Clarity
- Needs clarification
- Newbie friendliness
- 35/100