Bar Chart Displaying Wrong Y Values
- Dominant language
- Swift
- Stars
- 28k
- Forks
- 6k
- PR merge metrics
- No merged PRs in 30d
Description
* [X] I've read, understood, and done my best to follow the [*CONTRIBUTING guidelines](https://github.com/jjatie/Charts/blob/master/CONTRIBUTING.md).
## What did you do?
I generated a bar chart using the following:
**BarChartView**
```
private lazy var sampleChart: BarChartView = {
let chart = BarChartView()
chart.legend.enabled = false
chart.leftAxis.enabled = false
chart.rightAxis.labelCount = 4
chart.rightAxis.axisMinimum = 0
chart.drawBarShadowEnabled = false
chart.drawValueAboveBarEnabled = false
chart.doubleTapToZoomEnabled = false
chart.drawMarkers = true
chart.translatesAutoresizingMaskIntoConstraints = false
let data = generateData()
chart.data = data
let axisFormatter = CustomAxisFormatter(format: chartConfiguration.legendFormatter)
let groupWidth = data.groupWidth(groupSpace: groupSpace, barSpace: barSpace)
chart.xAxis.format(begin: firstXValue, end: lastXValue, groupWidth: groupWidth, axisFormatter: axisFormatter)
return chart
}()
```
**Properties used in the `groupBars` function**
```
private var groupSpace: Double { 0.43 }
private let barSpace = 0.00
private var barWidth: Double {
(1.00 - groupSpace) / 2
}
```
**How data is being provided to the chart**
```
private func generateData() -> BarChartData {
let sets: [BarChartDataSet] = chartConfiguration.series.map { series in
let entries = series.values.map { BarChartDataEntry(x: $0.x, y: $0.y) }
let dataSet = BarChartDataSet(entries: entries, label: series.name)
dataSet.colors = [series.color]
dataSet.drawValuesEnabled = false
return dataSet
}
let data = BarChartData(dataSets: sets)
data.barWidth = barWidth
data.groupBars(fromX: Double(firstXValue), groupSpace: groupSpace, barSpace: barSpace)
return data
}
```
**The format method being called on the chart creation**
```
private extension XAxis {
func format(begin: Int, end: Int, groupWidth: Double, axisFormatter: AxisValueFormatter) {
let numberOfGroups = end - begin + 1
self.axisMinimum = Double(begin)
self.axisMaximum = Double(begin) + groupWidth * Double(numberOfGroups)
self.valueFormatter = axisFormatter
self.drawGridLinesEnabled = false
self.centerAxisLabelsEnabled = true
self.labelPosition = .bottom
self.granularity = 1
self.yOffset = 8
}
}
```
**The values used to populate the chart**
```
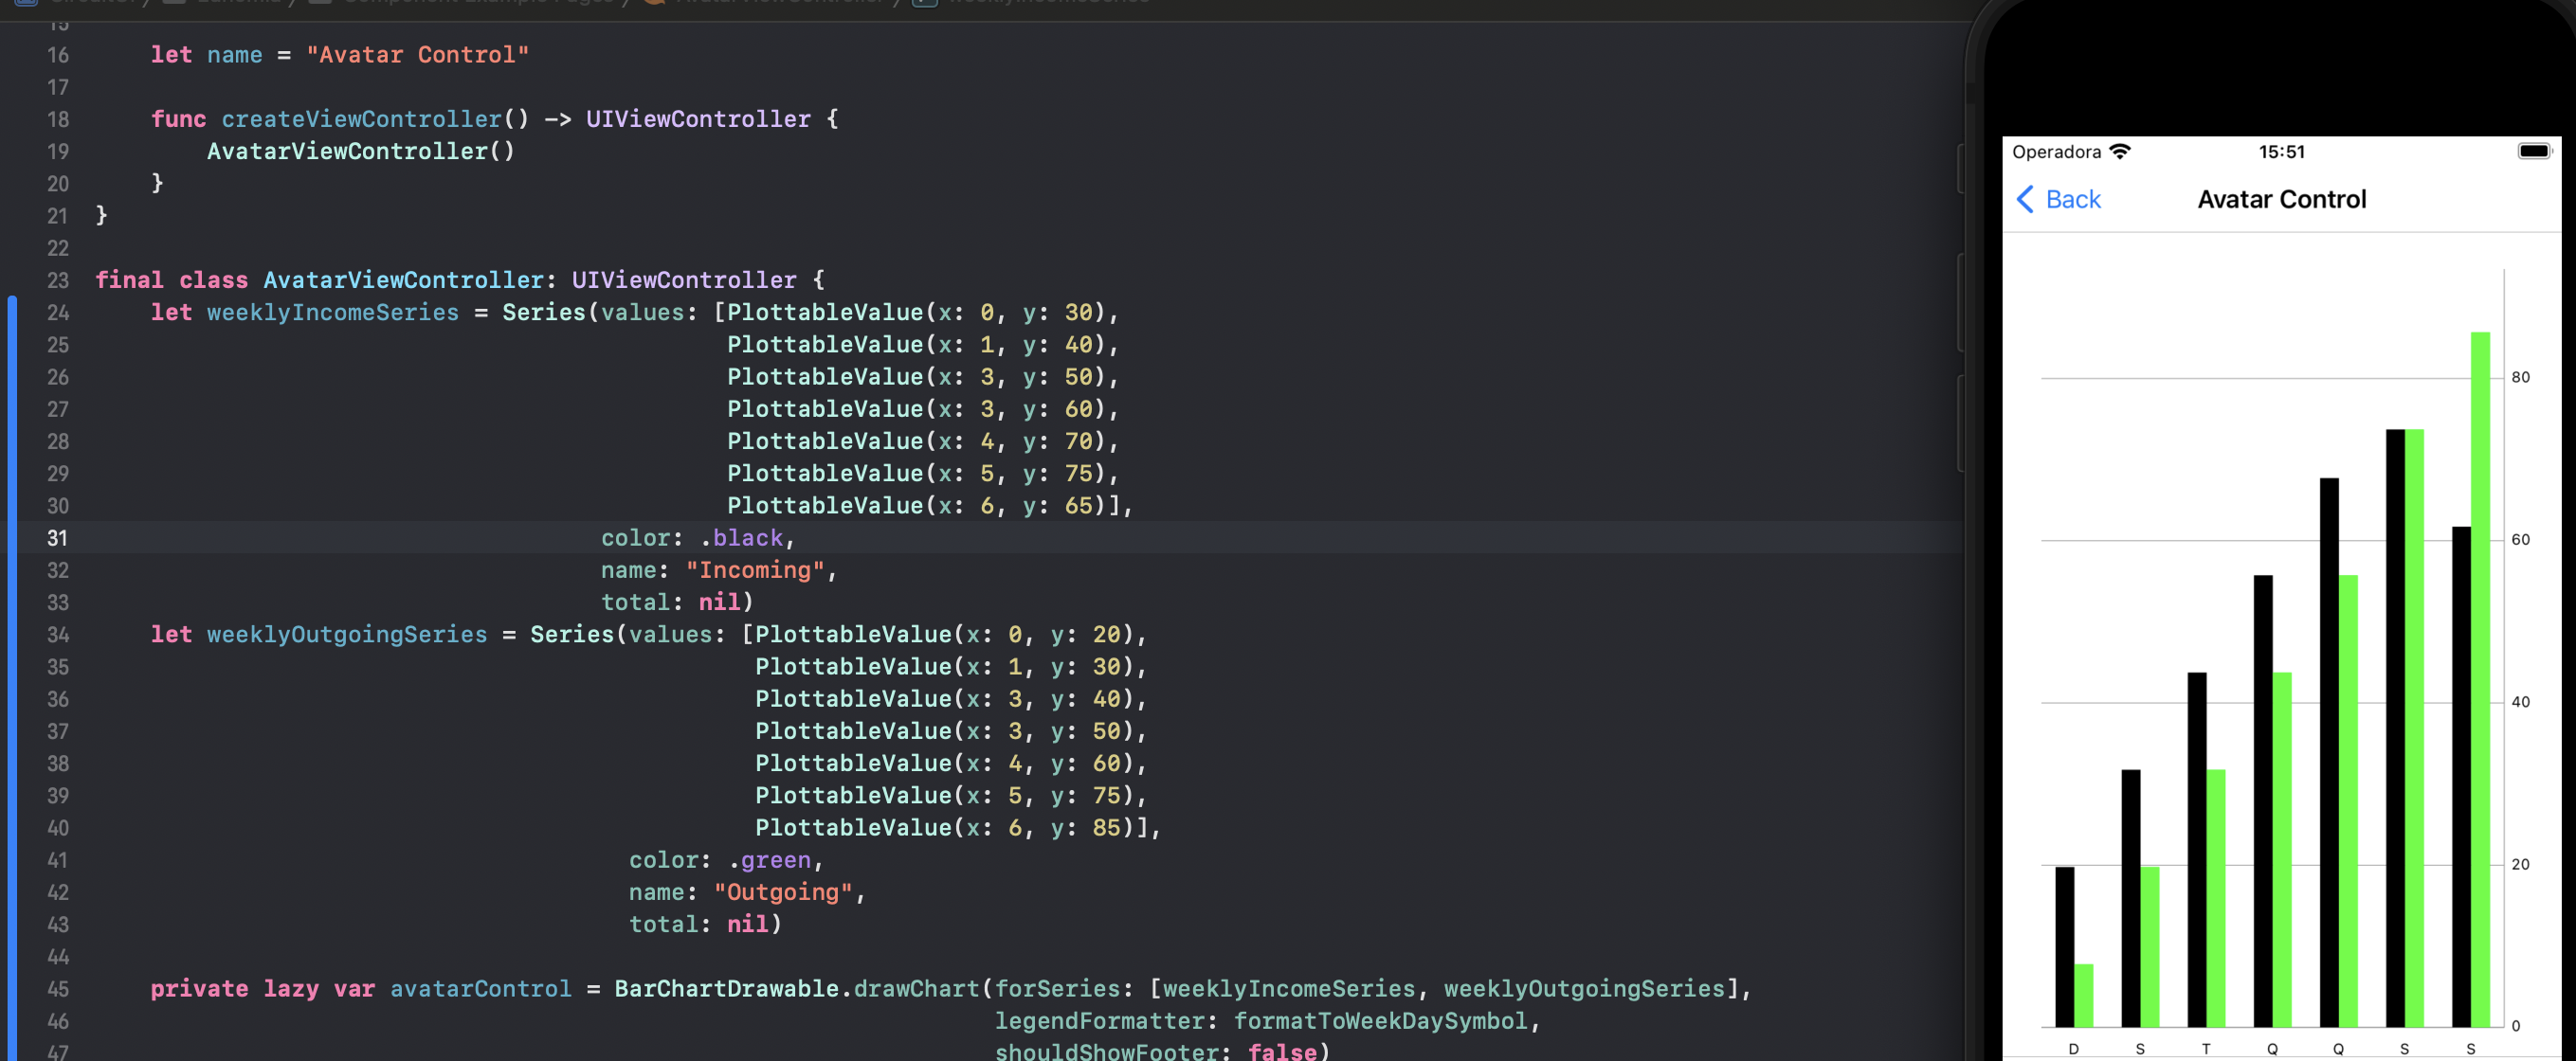
let weeklyIncomeSeries = Series(values: [PlottableValue(x: 0, y: 30),
PlottableValue(x: 1, y: 40),
PlottableValue(x: 3, y: 50),
PlottableValue(x: 3, y: 60),
PlottableValue(x: 4, y: 70),
PlottableValue(x: 5, y: 75),
PlottableValue(x: 6, y: 65)],
color: .black,
name: "Incoming",
total: nil)
let weeklyOutgoingSeries = Series(values: [PlottableValue(x: 0, y: 20),
PlottableValue(x: 1, y: 30),
PlottableValue(x: 3, y: 40),
PlottableValue(x: 3, y: 50),
PlottableValue(x: 4, y: 60),
PlottableValue(x: 5, y: 75),
PlottableValue(x: 6, y: 85)],
color: .green,
name: "Outgoing",
total: nil)
```
## What did you expect to happen?
The plotted values to match the injected ones.
## What happened instead?
## Charts Environment
**Charts version/Branch/Commit Number:** 4.0.3
**Xcode version:** 13.4.1
**Swift version:** 5.2
**Platform(s) running Charts:** Simulator iOS 15.5
**macOS version running Xcode:** 12.5
Contributor guide
Assessment
This issue has not been assessed yet.