Does the CombinedChartView support a graph like this?
- Dominant language
- Swift
- Stars
- 28k
- Forks
- 6k
- PR merge metrics
- No merged PRs in 30d
Description
## What did you do?
I created a CombinedChartView that displays both a bar graph and a line graph. The data supplied to the CombinedChartView can have a greater number of bar data points compared to the line data points.
## What did you expect to happen?
All the bar data points are still displayed.
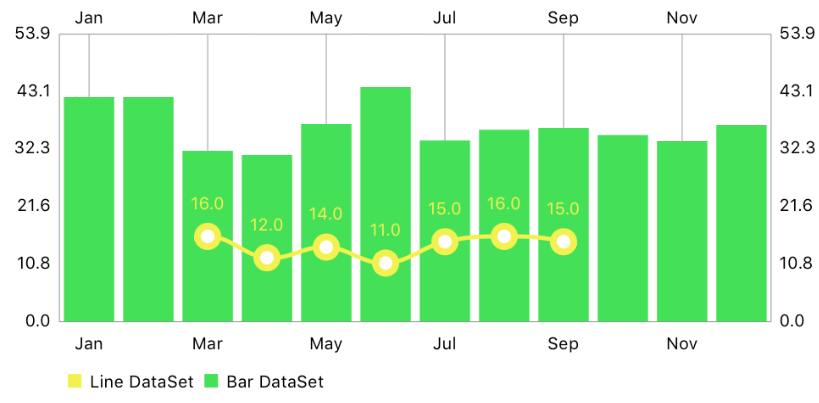
## What happened instead?
The CombinedChartView appears to zoom in to the area where there are available line data points. The remaining bars are not displayed because they didn't have corresponding line data points.
## Charts Environment
**Charts version/Branch/Commit Number: 4.0.3
**Xcode version: 13.3.1
**Swift version: 5
**Platform(s) running Charts: iOS
**macOS version running Xcode: 12.3.1
Contributor guide
Research direction
Start by reproducing the issue in a Swift iOS example using CombinedChartView with more bar data points than line data points. Trace how CombinedChartView determines its visible range from the supplied data. Done means all bar points remain visible even when the line data has fewer points.
Written by the indexing model from the issue text.
Assessment
- Tech stack
- swift
- Domain
- data-visualization, mobile-dev
- Issue type
- Bug
- Difficulty
- 3/5
- Estimated time
- 1-2 days
- Activity status
- Stale
- Clarity
- Mostly clear
- Newbie friendliness
- 35/100