Bar Chart: Adjust visible Y range according to currently visible maximum value
- Dominant language
- Swift
- Stars
- 28k
- Forks
- 6k
- PR merge metrics
- No merged PRs in 30d
Description
Thanks a lot for your lovely Charts package!
I am currently using it to develop a visualization component for one of my apps.
The remaining thing I am struggling with is changing the visible vertical Y range depending on the currently visible maximum value.
Here‘s an example to make things clear: Most values are around ±20, but there's one outlier with a value of 100:
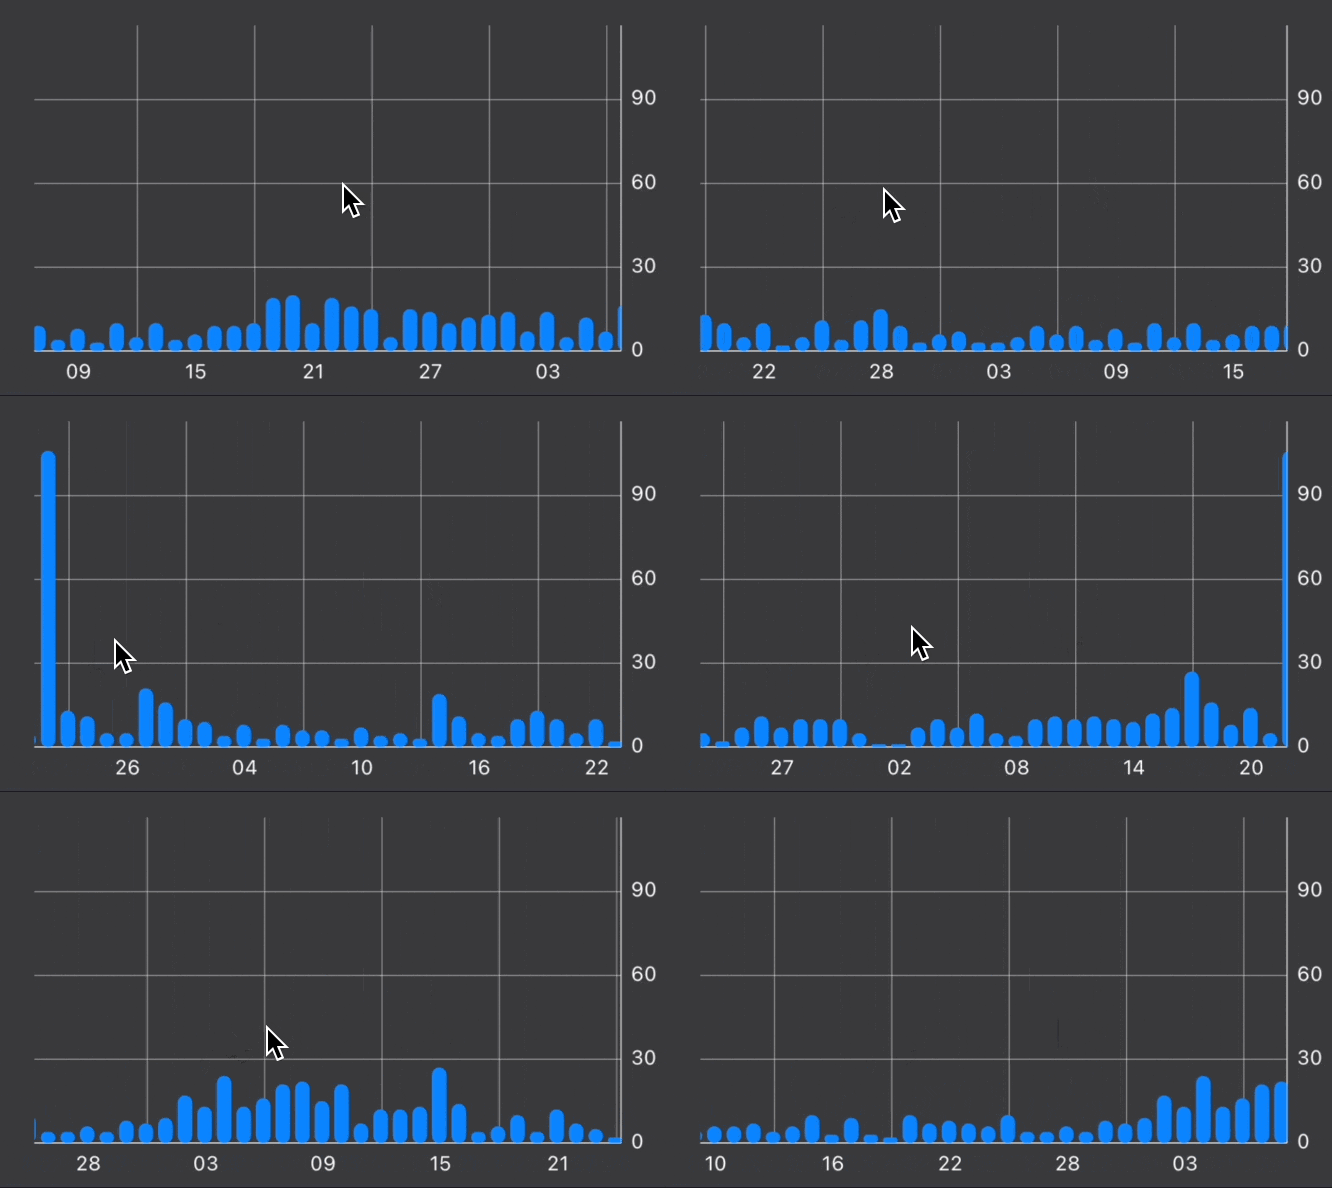
I want to adjust the Y range while this one outlier is not visible.
Right now I am using the `chartViewDidEndPanning` method to get the currently visible X range using `self.lowestVisibleX` and `self.highestVisibleX`. Using this information I can check in my data set what the current maximum Y value is.
Using this value, I try to adjust the `visibleYRange`:
```swift
self.chartView.setVisibleYRangeMaximum(maximum, axis: .right)
self.chartView.setVisibleYRangeMinimum(maximum, axis: .right)
```
And, because I want the Y axis to always start at 0, I am also calling this method:
```swift
self.chartView.moveViewTo(xValue: self.chartView.lowestVisibleX, yValue: maximum / 2, axis: .right)
```
This solution kinda works, but it is also kinda chunky:
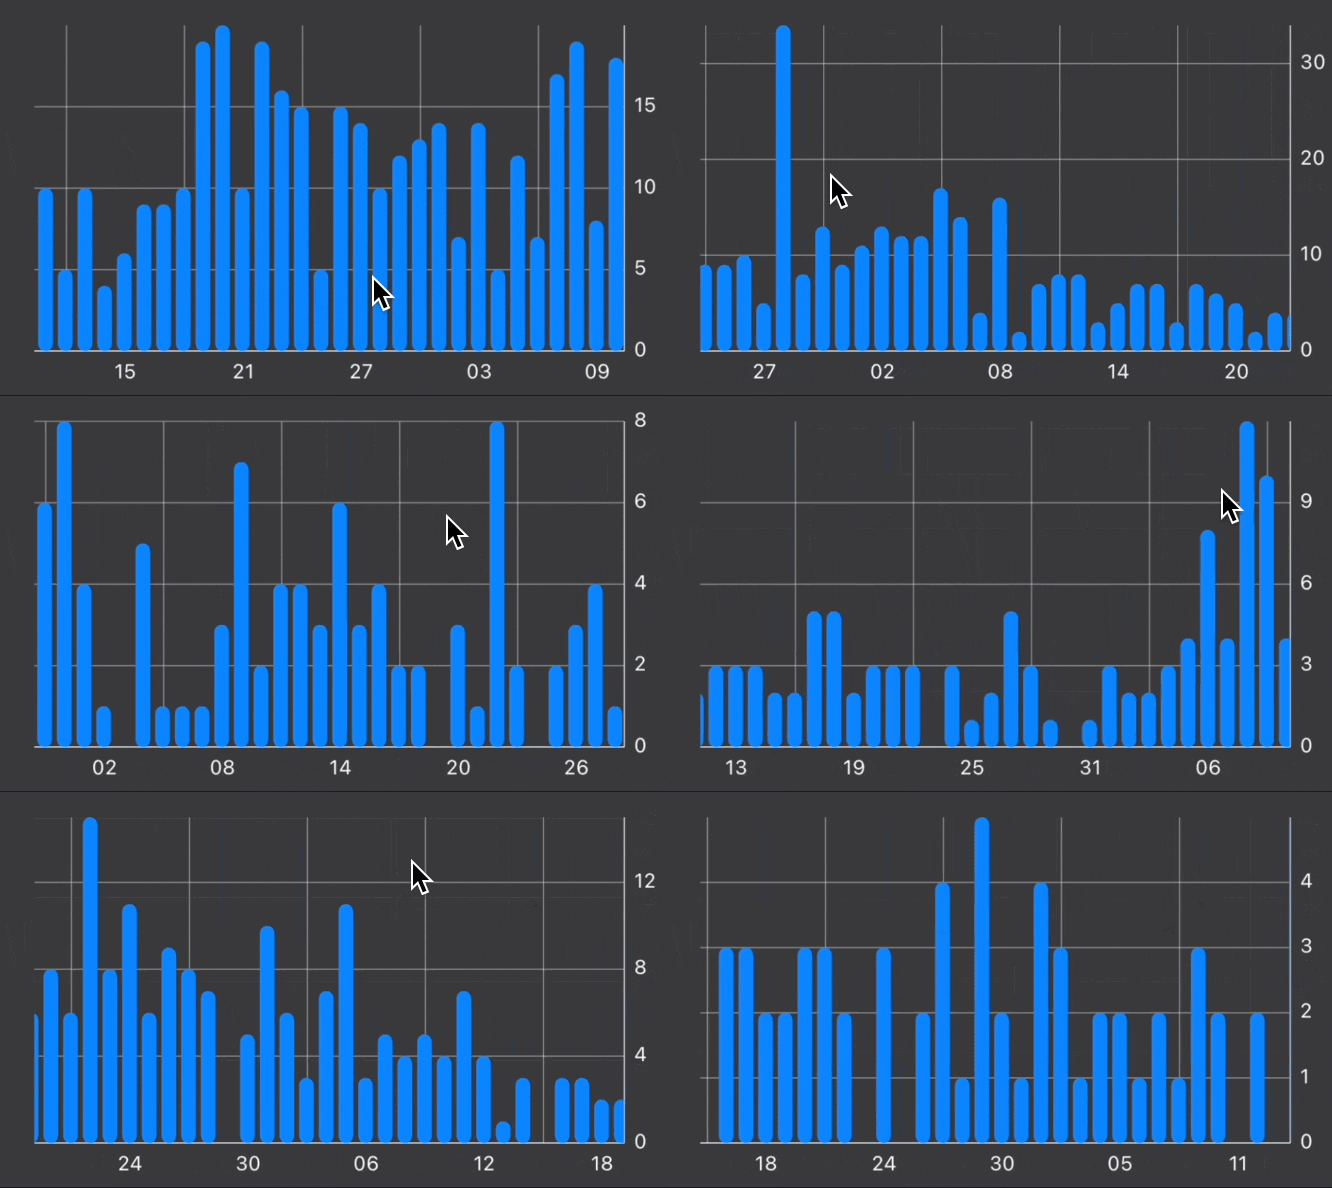
I am wondering if there‘s a more elegant (built-in?) way, maybe even animated just like Apple is doing it in the Health app:
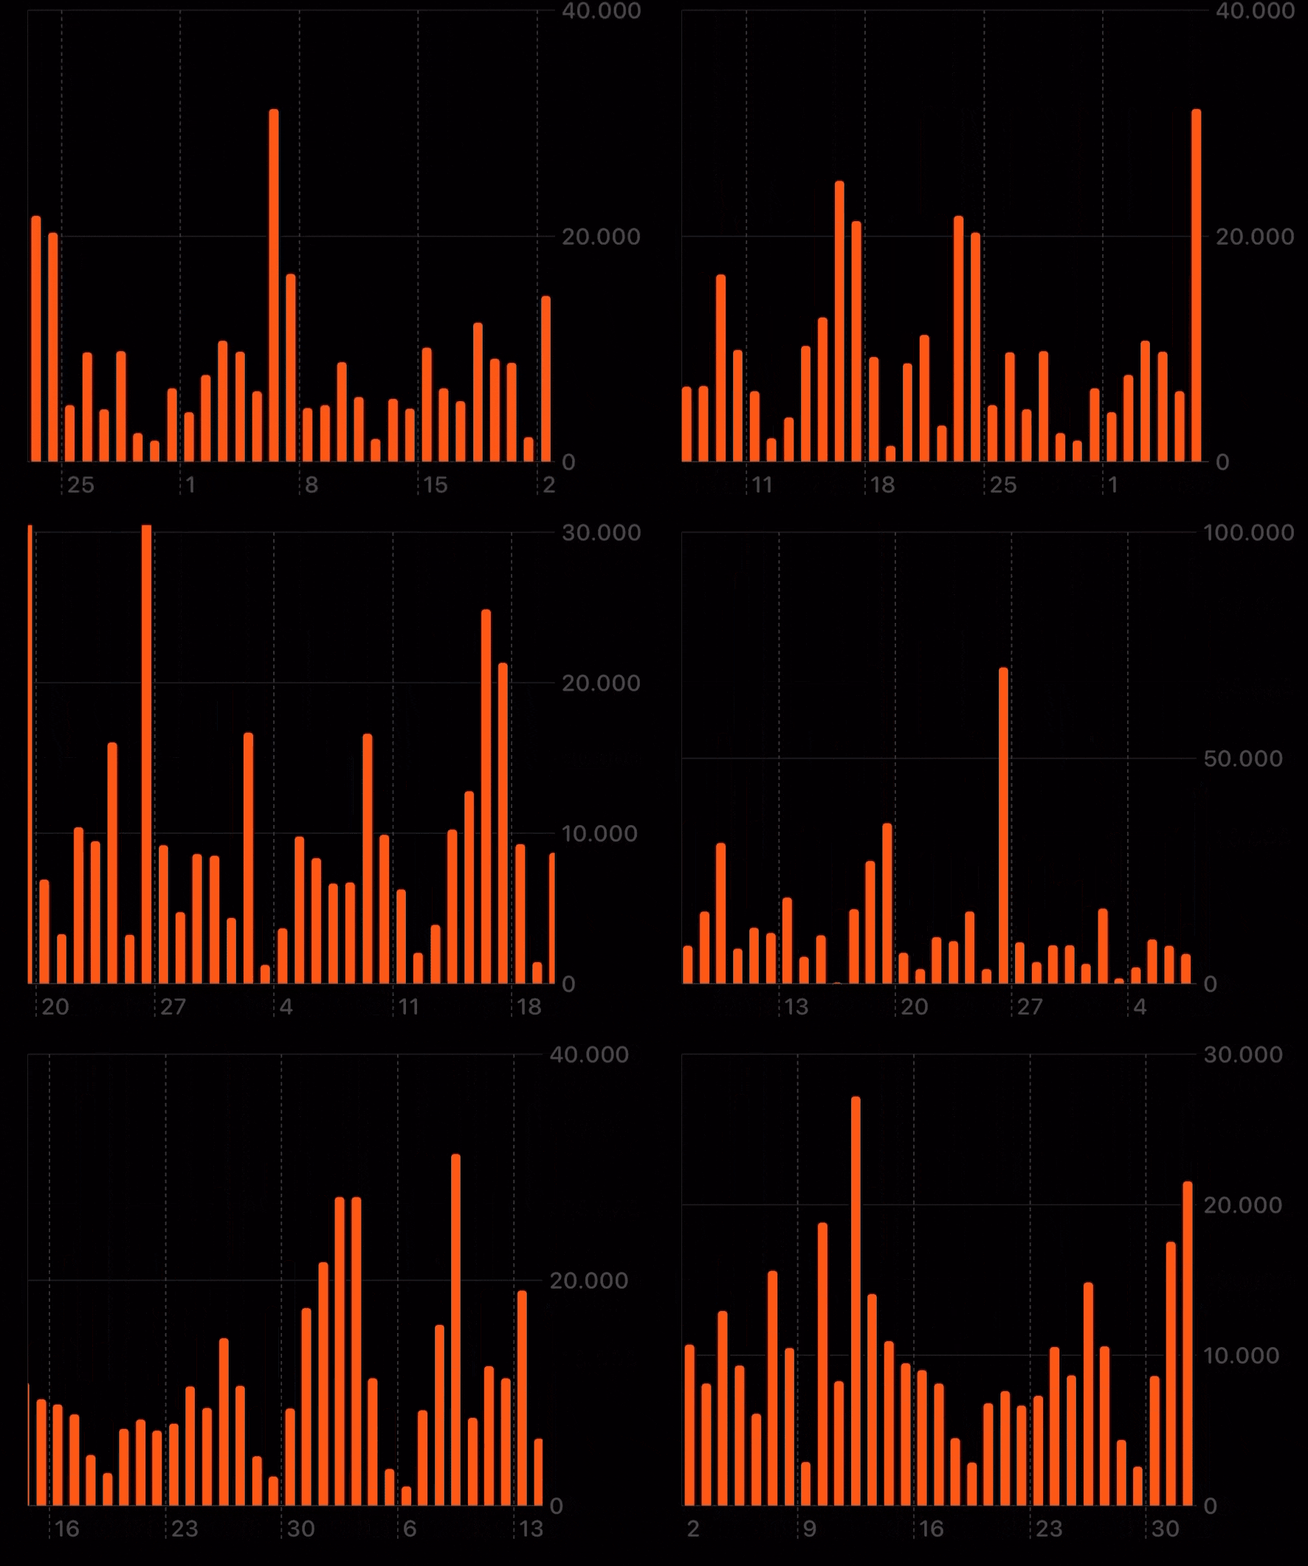
Happy to hear any feedback, or reports of people who have been working towards similar goals 🙏
Contributor guide
Assessment
This issue has not been assessed yet.